admin / September 15, 2021
Retail – Asset Class Report – August 2021
Retail – Asset Class Report – August 2021
Retail Asset Class Report– (Download Full Report -PDF)
NATIONAL OVERVIEW
The consensus heading into 2020 was another rough year on the Retail sector’s horizon, and that was before a global pandemic made nonessential in-person shopping quite literally illegal for a period. As Americans sheltered indoors, everyday activities such as going to the grocery store were now weighed under a contagion risk analysis. Consumption that would have normally been completed in-person has quickly flowed into online orders. The e-commerce share of retail consumption has steadily risen for more than two decades, reaching 11.8% in Q1 2020.1
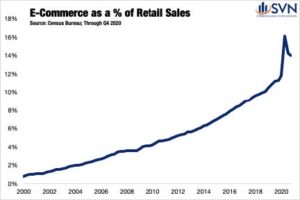
As the full effect of the lockdown reached a fever pitch in Q2, the share ballooned to 16.1%. While the share has come down to 14.0% through Q4, reflecting some natural reversion, the familiarity gained by consumers cannot be undone, and the pandemic has permanently accelerated some retail activity away from brick-and-mortar.
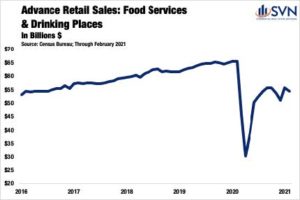
Of all the retailing subsets, no business model was more impacted in 2020 than food and beverage services. Brick-and-mortar retail (excluding food services) had already fully recovered to pre-COVID sales figures through the end of the year. Restaurants and bars, however, continue to struggle as restrictions on density, indoor permissiveness, and operating hours have all proved to be economic impediments. According to the Census Bureau’s Advance Retail Estimates for Food Services and Drinking Places, seasonally adjusted sales in February totaled $54.2B— down 17.0% year-over-year. Data provided by OpenTable, a restaurant reservation booking service, confirm that reservations remain down 37% through March 11th, 2021, as compared to a 2019 baseline.
According to Trepp, the delinquency rate on Retail CMBS has continued to improve in recent months but remains elevated. Through February 2021, the delinquency rate averaged 11.8%— down from 12.7% the month prior, though well above the 3.6% measured at the same point last year.
All else equal, 2021 should be a year of recovery in the Retail sector, especially as restrictions on density are further relaxed and the resumption of normalcy gains steam. Notwithstanding the short-term recovery, Retail remains in a period of secular reorganization, and the sector remains open to disruption for the foreseeable future.
Financial Performance
TRANSACTION VOLUME
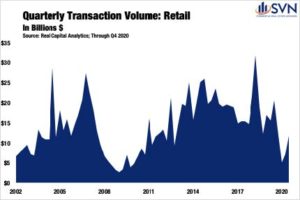
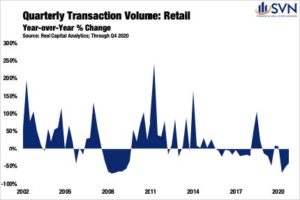
Transaction volumes sank so far in 2020 that they would have to look up to see rock-bottom. Deal volume fell by 25% in 2019 with $65.9B worth of assets changing hands, according to Real Capital Analytics. However, 2019 proved to just be the dress rehearsal, as volumes sank by another 43% in 2020, finishing the year with just $37.7B of total volume—the lowest level since 2010. Drugstores and Mall assets each recorded 14% increases in transaction activity, though the driving forces for each product type are very different. Drugstores benefited from their “essential” status and perceived safe-haven quality amid the pandemic. Malls, on the other hand, posted gains primarily due to the “hurdle effect.” In other words, because transaction volumes for Mall assets took a nosedive-descent of 89% in 2019, the resumption of some transaction activity was enough to post a positive gain. Big Box Retail assets posted the biggest drop-off in transaction activity between 2019 and 2020, falling by 62%.
CAP RATES AND PRICING
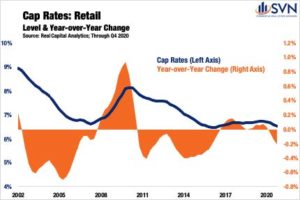
Cap rates for Retail properties posted marginal declines in 2020. Through Q4 2020, cap rates are down 6 bps from Q3 and 20 bps from the same time last year.2 Anchored and Grocery Retail properties posted the largest cap rate declines in 2020, falling by 28 bps and 15 bps, respectively. On the other side of the spectrum, Big Box Retail assets and Urban Store Fronts notched the largest year-over-year cap rate increases, rising by 14 bps and 8 bps, respectively.3
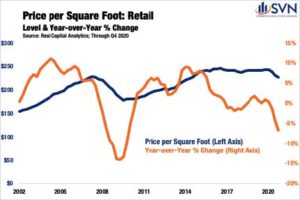
Despite cap rates falling in the Retail sector, property valuations took a hit in 2020, falling by 6.7%.4 Taken together, these data indicate that property-level incomes saw significant weakness through the year, and that declining cap rates were not necessarily a welcome sign to asset owners. Retail Centers saw the most softening in asset prices in 2020, recording a steep 13.2% year-over-year decline.5 Unanchored Retail assets followed next, recording a 7.5% drop in value.6 Following a step up in transaction volume, pricing improved for both Drugstore and Mall assets on a price per square foot basis in 2020, rising by 4.1% and 2.6%, respectively.7
MARKETS MAKING HEADLINES
SPENDING SOME TIME IN THE SUN SPENDING
Markets across the Southeast have quietly maintained strong local Retail performance despite COVID’s unprecedented disruption. The relative permanence of temperate weather has made creative solutions, such as increased outdoor dining, more successful than similar attempts in cool-weather states. As novel as the experience of getting drinks with friends in 15-degree weather is, a glass of beer should never get colder on the table the longer it goes unconsumed. In a city like Greenville, SC, one of the Southeast’s blossoming culinary hubs, the temperature rarely ever approaches freezing.
“Greenville Retail has proven itself to be exceptionally resilient due to several factors,” says Alex Dmyterko, Managing Director of SVN | BlackStream. “First, the Upstate area has extremely strong job growth. Additionally, the jobs tend to be high income as the area has become one of the largest concentrations of engineers in the country. Lastly, [Greenville] has experienced a rapid influx of people moving from larger, northern cities as people seek perceived COVID-safety and a gentler way of life. This growth has resulted in strong retail and restaurant sales.”
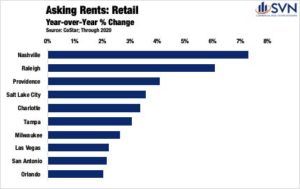
A recent CoStar report notes that while the Raleigh and Charlotte metro areas have seen Retail foot traffic drop by roughly 25%, comparatively, the two markets are holding up exceedingly well— especially when compared to major-coastal markets where the foot traffic dip ranges from -40% to -60%. These data match well with reported asking rent growth, as Raleigh and Charlotte posted gains of 6.1% and 3.4%, respectively.8
Louisville, Kentucky, a market that has gained steam in recent years from an influx of regional tourism, posted a 0.3% drop in Retail vacancy while absorbing nearly 650k square feet of new inventory.9 Nearby Lexington, Kentucky, a metro connected to Louisville via the “Bourbon Trail,” has posted a 9.5% population growth between 2010 and 2019, is enjoying similar success.10
There was no state over the past decade that had a higher concentration of fast-growing metros than Florida. Between 2010 and 2019, a total of 16 Florida metros experienced residential population growth exceeding 10% for the decade.11
The next closest State was Texas, with 13 metro areas accomplishing the same feat. The rapid expansion of Sunshine State metros has led to more consumption dollars cycled through local communities and a greater need for Retail space. Within Greater Daytona Beach, a coastal market accessible to nearby-landlocked-Orlando, Retail performance has “exploded in the past 2+ years, thanks in part to development and planning of [over 20K] new homes West of Interstate-95 and many new multifamily projects that are filling up quickly,” says Carl Lentz, Managing Director of SVN | Alliance Commercial Real Estate Advisors. “National retailers have taken note and Retail developers have taken advantage by constructing many new Retail opportunities along the LPGA & I-95 corridor.”
Macroeconomy
ECONOMIC GROWTH
The total value of all final sales of goods and services, investments, government expenditures, and net exports came out to a little more than $20.9T in 2020. After adjusting for inflation, 2020’s report card represents a 3.5% drop off from production and consumption levels measured in 2019.1
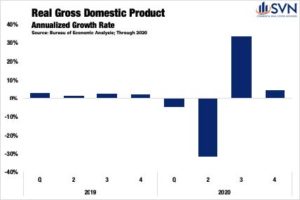
Of course, a marginal, single-digit percent change snapshot fails to capture the violent swings in economic activity recorded across quarters. In Q1 2020, while risks of a global pandemic were rising, the US economy seemingly continued along an autopilot-glide. It wasn’t until the last two weeks of the quarter that Times Square started to resemble the scenes out of a Stephen King novel.
For the quarter, annualized GDP growth came in at -5.0%, a harbinger of the pain to come. In the second quarter, a period defined by the worst days of the pandemic, the US economy shrank at a -31.4% annualized rate, the worst reading ever. In Q3, the resumption of some normalcy fueled the highest quarterly GDP figure on record at 33.4%. As the cold weather started to settle in during Q4, growth again started to cool. For the final period of Q4, the US economy expanded at just a 4.3% annualized rate.
In January 2020, the Congressional Budget Office released estimates for its expectations of growth in the then year ahead.2 The $22.1T forecast serves as an estimate of where the US economy would have finished the year had the pandemic not reached our shores. The shortfall between actual and forecasted GDP totaled $1.2T. While these figures may sound abstract, understanding them in terms of average wealth lost per person makes the drop off more appreciable. On average, every US citizen is $3,560.06 worse off through the end of 2020 compared to a version of the past year where COVID did not exist.
With serotonin levels now surely in low supply, there is, at least, significant hope that 2021 will be a year of earnest recovery. As of the March WSJ Economic Forecasting Survey, on average, leading economists expect the US economy to grow by 6.0%. If reality ends up matching expectations, 2021 will mark the fastest annual growth since 1984— the first non-Orwellian reference to that year in some time.
LABOR MARKET
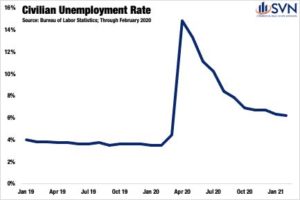
If the US economy were a human body, the labor market would be the beating heart— and in 2020, even the cardiologists were complaining of chest pain. Between February and April, the civilian unemployment rate went from an all-time low of 3.5% to a stratospheric, post- Great Depression high of 14.8%. The national lockdown mimicked a labor market trajectory only previously observed at local levels following natural disasters. Between December 2007 and the start of June 2009, the official start and end dates of the Great Recession, a little more than 37 million people filed for first-time jobless benefits; in 2020, it took just nine weeks to eclipse the same total. From the week ending March 21st, 2020, through the week ending on March 20th, 2021, 82.6 million initial unemployment claims have been filed, exceeding the Great Recession total by 122% and good for roughly one claim for every two Americans in the labor force.
From K-, W- Crooked L-, W-, and V-shaped recoveries, alphabet enthusiasts have had their hands full this past year. After the initial lockdown, labor markets quickly sprang back between May and October, with the unemployment rate falling by 7.9%, landing at 6.9%. Progress has slowed in the months since, with the unemployment rate settling at 6.2% through February 2021. Of course, the nature of losses and improvements has not been felt proportionally across different industries. For workers employed in Financial Services, Government, Agriculture, Education and Health Services, and Manufacturing, employment losses in 2020 ranged from mild to non-existent. On the other side of the spectrum, the Leisure and Hospitality sector continues to battle an industry-level unemployment rate that is 7.8% higher than it was one year ago.
INTEREST RATES & INFLATION EXPECTATIONS
As COVID’s arrival on US shores settled in, Treasuries recalibrated to the dampened outlook, falling to new all-time lows. Treasury rates dipped by more than 100 bps in less than one month, reaching their bottom of 0.54% on March 9th, 2020. By August, a rebound of economic activity and job growth was already underway, allowing for the return of some forward-looking optimism. As vaccine distribution ramps up and the federal government infuses additional stimulus into businesses and households, market expectations have firmed, and Treasury rates have returned to pre-COVID levels.
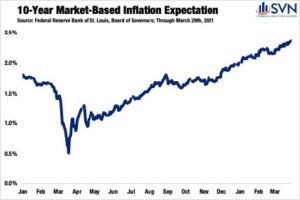
With the possibility of several tailwinds hitting the economy’s sails all at once, some market watchers are beginning to sound the alarm on inflation. Market-based inflation expectations can be measured by taking the difference between 10-Year Treasuries, which are quoted nominally, and 10-Year inflation-adjusted securities, commonly referred to as TIPS. This spread has soared over the past year, reaching 2.36% on March 29th, 2021— the highest level since 2013. With inflation expectations rising, questions over the ‘how’ and ‘when’ the Federal Reserve might next raise rates have also come to center stage. Nevertheless, Fed Chair Jerome Powell has reiterated that the Central Bank is committed to an accommodative monetary regime, and a rate-hike should not be expected until at least 2023.
Sources:
1 Census Bureau; Through Q4 2020
2 Real Capital Analytics; Through Q4 2020
3, 4, 5, 6, 7 Ibid.
8 CoStar; Through Q4 2020
9 Ibid.
10 Census Bureau; Through 2019
11 Ibid.
1 https://fred.stlouisfed.org/series/GDPC1#0
2 https://www.cbo.gov/data/budget-economic-data#4
ABOUT SVN®
SVN International Corp. (SVNIC) is a full-service commercial real estate franchisor of the SVN® brand. Spanning more offices in the United States than any other commercial real estate firm, in nearly 200 locations serving 500 markets, and with continuing global expansion, SVN is one of the industry’s most recognized names. SVN provides sales, leasing, corporate services, and property management services to clients across the globe. SVN Advisors also represent clients in auction services, corporate real estate, distressed properties, golf & resort, hospitality, industrial, investment services, land, medical, multifamily, office, retail, self-storage, and single tenant investments. All SVN offices are independently owned and operated. For more information, visit www.southlandcommercial.com.
Look for all of the 2022 Commercial Asset Class Reports at southlandcommercial.com (linked below).
Multi-family Commercial Asset Class Report
Retail Commercial Asset Class Report
Office Commercial Asset Class Report
Industrial Commercial Asset Class Report
View all current SVN Southland listings here.
Meet the whole SVN Southland team
« Previous Next »


