admin / February 8, 2022
Commercial Real Estate Asset Class – Office
Commercial Real Estate Asset Class – Office
Contents
- National Overview
- Financial Performance
- Markets Making Headlines
- Macroeconomy
- About SVN
Commercial Real Estate Asset Class: Office – (Download Full PDF)
National Overview
Get your dog off your lap and hold onto your pajamas for
this bit of news: there still is an Office sector! Last year was difficult for Office no matter how you slice it. Property-level financials absorbed a size-able hit, and the sector is home to more speculation than a purchase of GameStop’s stock on margin. 2020 was a giant natural experiment, and it has challenged our core assumptions about how firms and workers interact with physical workspace to optimize productivity.
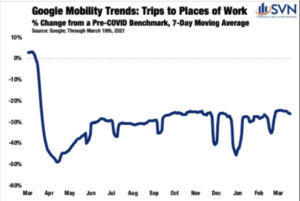
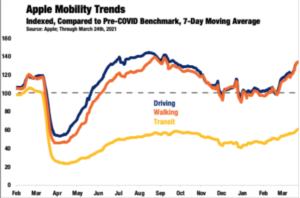
According to Moody’s Analytics REIS, rents in the sector only fell by 0.7% in 2020, though they are forecast to fall a sizable 7.5% in 2021. Moreover, Moody’s does not anticipate rents making a full recovery until 2026. According to Google Mobility Trends, at the height of the April lockdown, daily trips into places of work fell by an average of 49% compared to a pre-pandemic benchmark. Through the end mid-March, this mark has improved to 25% below pre-COVID norms still far off from normal, though an accelerating vaccination rollout brings the promise of a more rapid return to normalcy.
However, even as the health concerns of having full-desks wanes, the Office sector cannot get around the fact that the genie is out of the bottle: work from home (WFH), in some form, is here to stay. A recent PwC survey that polled senior executives in the US found that only one-in-five believe that having all workers physically in the Office five days a week is optimal.2 Moreover, 83% of employers reported that their team’s transition to remote work has been a success. These data fall in-line with findings reported in the 2021 Emerging Trends in Real Estate (ETRE) Report, produced by PwC and ULI. According to ETRE, 94% of real estate professionals surveyed believe that companies will allow for more remote working in the future. Notably, 64% of those surveyed indicated that additional square footage was needed to meet COVID-related social distancing guidelines. Whether it be via health concerns or pushback against the normalization of sardine-can-esque workspaces, there is a growing sense that the post-pandemic setup will allocate
additional square footage per worker, offering a partial offset to the WFH headwind.
As more companies are rolling out return-to-office plans, we may want to wait and see before committing ourselves to never buying a pair of work pants again. If Google’s recent $7B commitment to increasing its physical footprint is any indication, offices will remain integral to corporate culture post-pandemic, even if there will be more utilization flexibility.3 It is not likely, practical, or optimal for WFH to become the dominant workplace setup of the future, though the same can be said for strict desk-only setups as well. A convergence of the two models is already well underway, and where the new equilibrium settles will be a point of
recalibration for forward-looking Office demand.
Financial Performance
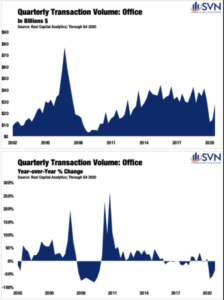
As was the case for all corners of the commercial real estate investment universe in 2020, transaction activity for Office dried up in the second quarter before rebounding in the second half of the year. For the year, the Office sector’s transaction volume totaled $86.1B, a 40.1% dip from 2019. Notably, it took Office considerably longer than Multifamily and Industrial to begin its
recovery. After dropping by 60.1% between the first and second quarters, transaction activity only recovered in Q3 by 17.1%. A more normal deal flow returned in the fourth quarter when transaction volume jumped by 90.2% to $27.6B.
CAP RATES AND PRICING
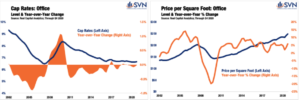
Cap rates for Office properties held steady throughout 2020, averaging 6.6% in all four quarters.4 Only Single-Tenant and Medical Office properties observed any material year-over-year changes, and still, they were modest. Single-Tenant Office properties finished the year up 14 bps from where they stood twelve months ago, reflecting an aversion to concentrated risk. Conversely, Medical Office properties saw cap rates edge down by 17 bps over the same period.
Prices for Office assets finished the year up 5.9% from the end of 2019. Central business district-located assets were the clear-cut laggard, with assets falling 0.2% year-over-year through Q4. Over the same period, Medical Office valuations grew by a pedestrian 1.8%, and Single-Tenant valuations jumped by a more robust 5.0%. Suburban Office assets enjoyed the most noteworthy increase
over the year, with pricing up by 6.6% from Q4 2019— the highest reading for any Office sub-property type since Q1 2019.
Markets Making Headlines
KEEPING A BUCKEYE ON THE MIDWEST
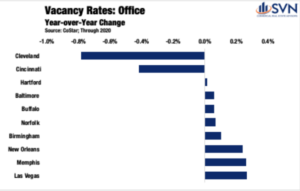
While 2020 had several examples of local Office sector success, the Midwest blew every other region of the US out of the water. Of course, even for those markets that saw some success, last year was no bed of roses. Nevertheless, Ohio’s Big Three (Cincinnati, Columbus, and Cleveland), Indianapolis, Pittsburgh, and Detroit all held onto at least some positive momentum. Of the Top-50 US metros, no city posted had a more positive rise in occupancy in 2020 than Cleveland.
Between Q4 2019 and Q4 2020, Office vacancy rates dropped by 0.8%, settling at 7.5%.5 The only other metro area to post a dip in vacancy rates in 2020 was none other than nearby Cincinnati, with availability falling from 10.0% to 9.6%.6 Transaction volume in Cincinnati and Columbus were both on the high end
compared to other metros last year. According to Real Capital Analytics, the
Cincinnati Office market was one of only six other tracked areas to see the total deal volume in 2020 exceed the total set in 2019, rising 7.9%.
Three of the other five metros to also post higher deal flows are nearby Midwestern metros: Indianapolis (+37.3%), Detroit (+15.0%), and Pittsburgh (+7.6%). For Columbus, transaction volume fell 8.5% year-over-year, though the decline is modest compared to the 40.1% dip measured nationally. Two undergirding themes of this year’s Columbus & Cleveland Commercial Real Estate Virtual Summits were that both markets had entered 2020 with the wind at their backs, and strong fundamentals remain in place to support a dynamic
recovery. “The Columbus, Ohio area continues to lead the Midwest in most economic indicators,” says Doug Wilson, Managing Director of SVN | Wilson Commercial Group, LLC. In addition to leading the region in “population growth, job growth, and wage growth,” Columbus remains attractive due to its density of high-performing companies that are “culture-sensitive,” which Wilson describes as “businesses preferring the traditional Office building dynamics
to help nurture that culture. For this reason, Offices will be attractive investment real estate for the foreseeable future in the Central Ohio marketplace.”

THE GRASS IS ACTUALLY GREENER: MAJOR METRO-ADJACENT OFFICE MARKETS
The pandemic was and continues to be anything but kind to central business district-located Office properties. In-office
density remains a pressing concern, though it does not hold a candle to worries of traversing congested mass transit
systems.
Apple Mobility Data indicates that transit system usage remains down by roughly 39% through mid-March 2021 compared
to a pre-COVID benchmark. Driving trips, however, are up more than 33%. Suburban Office markets, especially those right on
the periphery of major metros, are benefiting from a migration away from density.
A rush on single-family homes driven by pent-up household formations in the maturing Millennial cohort had already been supporting both suburban residential and Office demand heading into the pandemic. Once COVID hit and urbanized- lifestyle amenities became seemingly nonexistent, the rush toward the exit only grew.
Employers are responding to the outpour of workers into nearby suburbs by saying, “where you go, I will go too.” The Hub-and-Spoke setup has become an emerging Office distribution model, which blends a centrally located headquarters and satellite locations radially dispersed through nearby suburbs.
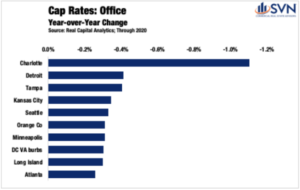
According to Real Capital Analytics, in 2020, Office cap rates fell in the Washington, DC Virginia and Maryland suburbs, declining by 31 and 13 bps, respectively. Just outside of New York City, cap rates on Long Island fell by 30 bps. The trend held up in LA, where cap rates in nearby Orange County fell by 31 bps, and Inland Empire edged lower by 4 bps.
Macroeconomy
ECONOMIC GROWTH
The total value of all final sales of goods and services, investments, government expenditures, and net exports came out to a little more than $20.9T in 2020. After adjusting for inflation, 2020’s report card represents a 3.5% drop off from production and consumption levels measured in 2019.
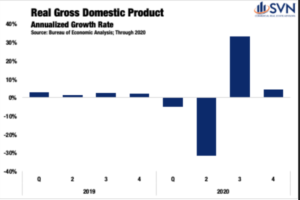
Of course, a marginal, single-digit percent change snapshot fails to capture the violent swings in economic activity recorded across quarters. In Q1 2020, while risks of a global pandemic were rising, the US economy seemingly continued along an autopilot-glide. It wasn’t until the last two weeks of the quarter that Times Square started to resemble the scenes out of a Stephen King novel.
For the quarter, annualized GDP growth came in at -5.0%, a harbinger of the pain to come. In the second quarter, a period defined by the worst days of the pandemic, the US economy shrank at a -31.4% annualized rate, the worst reading ever. In Q3, the resumption of some normalcy fueled the highest quarterly GDP figure on record at 33.4%. As the cold weather started to settle in during Q4, growth again started to cool. For the final period of Q4, the US economy expanded at just a 4.3% annualized rate.
In January 2020, the Congressional Budget Office released estimates for its expectations of growth in the then year ahead.2 The $22.1T forecast serves as an estimate of where the US economy would have finished the year had the pandemic not reached our shores. The shortfall between actual and forecasted GDP totaled $1.2T. While these figures may sound abstract, understanding them in terms of average wealth lost per person makes the drop off more appreciable. On average, every US citizen is $3,560.06 worse off through the end of 2020 compared to a version of the past year where COVID did not exist.
With serotonin levels now surely in low supply, there is, at least, significant hope that 2021 will be a year of earnest recovery. As of the March WSJ Economic Forecasting Survey, on average, leading economists expect the US economy
to grow by 6.0%. If reality ends up matching expectations, 2021 will mark the fastest annual growth since 1984— the first non-Orwellian reference to that year in some time.
LABOR MARKET
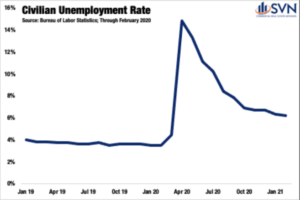
If the US economy were a human body, the labor market would be the beating heart— and in 2020, even the cardiologists were complaining of chest pain. Between February and April, the civilian unemployment rate went from an all-time low of 3.5% to a stratospheric, post-Great Depression high of 14.8%. The national lockdown mimicked a labor market trajectory only previously
observed at local levels following natural disasters. Between December 2007 and the start of June 2009, the official start and end dates of the Great Recession, a little more than 37 million people filed for first-time jobless benefits; in 2020, it took just nine weeks to eclipse the same total. From the week ending March 21st, 2020, through the week ending on March 20th, 2021, 82.6 million initial unemployment claims have been filed, exceeding the Great Recession total by 122% and good for roughly one claim for every two Americans in the labor force.
From K-, W- Crooked L-, W-, and V-shaped recoveries, alphabet enthusiasts have had their hands full this past year. After the initial lockdown, labor markets quickly sprang back between May and October, with the unemployment rate falling by 7.9%, landing at 6.9%. Progress has slowed in the months since, with the unemployment rate settling at 6.2% through February 2021. Of course, the nature of losses and improvements has not been felt proportionally across different industries. For workers employed in Financial Services, Government, Agriculture, Education and Health Services, and Manufacturing, employment losses in 2020 ranged from mild to non-existent. On the other side of the spectrum, the Leisure and Hospitality sector continues to
battle an industry-level unemployment rate that is 7.8% higher than it was one year ago.
INTEREST RATES & INFLATION EXPECTATIONS
As COVID’s arrival on US shores settled in, Treasuries recalibrated to the dampened outlook, falling to new all-time lows. Treasury rates dipped by more than 100 bps in less than one month, reaching their bottom of 0.54% on March 9th, 2020. By August, a rebound of economic activity and job growth was already underway, allowing for the return of some forward-looking optimism. As vaccine distribution ramps up and the federal government infuses additional stimulus into businesses and households, market expectations have firmed, and Treasury rates have returned to pre-COVID levels.
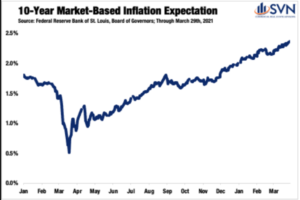
With the possibility of several tailwinds hitting the economy’s sails all at once, some market watchers are beginning to sound the alarm on inflation. Market-based inflation expectations can be measured by taking the difference between 10-Year Treasuries, which are quoted nominally, and 10-Year inflation-adjusted securities, commonly referred to as TIPS. This spread has soared over the past year, reaching 2.36% on March 29th, 2021— the highest level since 2013. With inflation expectations rising, questions over the ‘how’ and ‘when’ the Federal Reserve might next raise rates have also come to center stage. Nevertheless, Fed Chair Jerome Powell has reiterated that the Central Bank is committed to an accommodative monetary regime, and a rate-hike should not be expected until at least 2023.
ABOUT SVN®
SVN International Corp. (SVNIC) is a full-service commercial real estate franchisor of the SVN® brand. Spanning more
offices in the United States than any other commercial real estate firm, in nearly 200 locations serving 500 markets, and
with continuing global expansion, SVN is one of the industry’s most recognized names. SVN provides sales, leasing,
corporate services and property management services to clients across the globe. SVN Advisors also represent clients
in auction services, corporate real estate, distressed properties, golf & resort, hospitality, industrial, investment services,
land, medical, multifamily, office, retail, self-storage and single tenant investments. All SVN offices are independently
owned and operated. For more information, visit www.svn.com/.
Look for all of the 2022 Commercial Asset Class Reports at southlandcommercial.com (linked below).
Multi-family Commercial Asset Class Report
Retail Commercial Asset Class Report
Office Commercial Asset Class Report
Industrial Commercial Asset Class Report
View all current SVN Southland listings here.
« Previous Next »


