admin / April 4, 2022
Commercial Real Estate Asset Class – Industrial
Industrial Commercial Real Estate Asset Class
Contents
- National Overview
- Financial Performance
- Markets Making Headlines
- Macroeconomy
- About SVN
Commercial Real Estate Asset Class: Industrial – (Download Full PDF)
National Overview
INDUSTRIAL
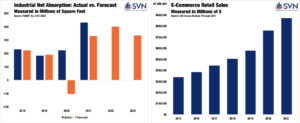
“All good things must come to an end,” said nobody in the Industrial sector in 2021. As the US economy continues to modernize and consumer behavior evolves, the Industrial sector has stood as a winner at every step along the way. Heading into 2021, the National Association for Industrial and Office Parks (NAIOP) forecasted that net absorption on the Industrial sector would total 329.5 million square feet for the calendar year — a figure that would have represented a 28% increase over the previous record high. When all was said and done, the Industrial sector posted net absorption totals of 432.5 million square feet, blowing past the previous record by more than 68%.1
With an eye on the horizon, NAIOP anticipates that fervent demand will continue to outpace new supply leading, with net absorption forecast at a robust 401.4 million square feet.
Even as COVID restrictions became less widespread in 2021 and consumers returned to shopping aisles, in absolute terms, last year was the most active for e-commerce consumption on record. In 2020, e-commerce retail sales jumped by 32%, landing at $759.6 billion.2 In 2021, e-commerce retail sales grew by 14.6%, coming in at $870.7. Moreover, 2021’s e-commerce sales growth rate of 14.6% is well in line with the pre-pandemic pattern.3 In the five years leading up to 2020, e-retailing grew by an average of 14.2% per year, while never growing slower than 13.4% or faster than 15.4%.4
Hefty demand growth coming from the steady surge of e-retailing has sent prices in the sector soaring. Noted by SVN® Industrial Product Chair Curt Arthur, SIOR, “the price index for industrial properties rose a record 28.1% from a year ago, the fastest annual rate among the major property sectors, according to Real Capital Analytics.” Further, transaction activity reached a fever pace towards the end of last year, as December alone “was the most active month in US history with one-month sales exceeding annual totals from 2008-2011.”
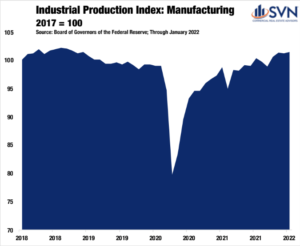
Pushing our e-shopping carts to the side, it isn’t just e-retailing distribution facilities that are responsible for Industrial’s record year — manufacturing
also had a significant role to play. The Board of Governor’s Industrial Production Index for Manufacturing, which measures the inflation-adjusted output of manufacturing activities, saw a steep drop-off during the pandemic lockdowns, with production declining by nearly 16% month-over-month in April 2020. Now, as of January 2022, manufacturing production has made up all its lost ground, and output currently stands at its highest level since Fall 2018.5
1. NAIOP
2. US Census Bureau
3. US Census Bureau
4. US Census Bureau
5. Board of Governors of the Federal Reserve
Financial Performance
TRANSACTION VOLUME
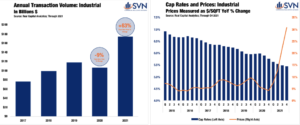
The Industrial sector maintained its solid momentum in 2021, posting the most transaction volume of any commercial property type other
than Multifamily. For the calendar year, according to Real Capital Analytics, $173.6 billion of Industrial assets changed hands in 2021.
Compared to 2020 levels, last year’s transaction volume totals rose by about 63% — the second-lowest mark across the core-four commercial property types.6 However, the only reason why Industrial’s 2021 transaction growth rate stands below Retail and Multifamily is because of its strong 2020, despite macroeconomic headwinds. In 2020, sans Industrial, all CRE property types saw declining transaction volumes between 24% and 38%.7 Meanwhile, Industrial only took a slight step back, declining by just over 9% in 2020.8 Compared to 2019’s previous peak, 2021’s transaction volume totals are up by an impressive 48%.9
CAP RATES AND PRICING
If Sir Isaac Newtown had been invested in the Industrial sector, perhaps the phrase would have been “what goes up must go down, and for Industrial cap rates, what’s already down can just keep on going.” Measured year-over-year, Industrial cap rates have fallen every quarter since Q3 2010.10 Through Q4 2021, Industrial cap rates are down to a lowly 5.4% — a decline of 32 bps from one year ago.11 Across the different Industrial sector sub-types, Warehouse assets saw the most significant cap rate compression in 2021, declining by a weighty 42 bps, bringing cap rates down to 5.3%.12 Single Tenant Industrial space also saw steady cap rates declines, with yielding falling 31 bps year-over-year to average
5.5% in Q4 2021.13 Despite the rebound in manufacturing activity measured in 2021, cap rates for Flex Industrial space ticked up marginally last
year, rising by 8 bps to land at 6.1% through Q4 2021.14
With cap rates declining to new all-time lows in 2021, significant pricing pressure was felt throughout the industrial sector. Measured year-over-
year on a price per square foot basis, valuations ended 2021 30.8% higher than they were one year ago — the highest mark of all commercial real estate property types.
6. Real Capital Analytics; Through 2021
7. Real Capital Analytics; Through 2021
8. Real Capital Analytics; Through 2021
9. Real Capital Analytics; Through 2021
10. Real Capital Analytics; Through Q4 2021
11. Real Capital Analytics; Through Q4 2021
12. Real Capital Analytics; Through Q4 2021
13. Real Capital Analytics; Through Q4 2021
14. Real Capital Analytics; Through Q4 2021
Markets Making Headlines
1-HOUR DELIVERY LOCATION, LOCATION, LOCATIONS
Across most commercial real estate verticals, Gateway markets have lagged the rest of the pack during the pandemic. Still, major metros have not lost their shine when it comes to Industrial CRE performance. Even as residents have left costly coastal metros like New York and Los Angeles on the margins, these markets remain behemoths of population agglomeration. As of the 2020 Census, there were more than 20 million people living in the New York MSA and more than 13 million living in the Los Angeles MSA. No other metro area is above 10-million residents.
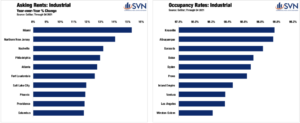
With respect to Industrial space demand in major markets, in short, the conversion from physical retail to e-retail has far outweighed any marginal population losses. In Northern New Jersey, an area that sits with the Greater New York Metropolitan Area, Industrial rents per square foot surged by 14.1% last year, according to CoStar — the second-best reading in the country. From a valuation perspective, the North New Jersey area saw the third-highest levels of asset appreciation last year, growing 19.8%.15
Moving over to the West Coast, the Inland Empire — an expansive semi-urban area directly adjacent to Los Angeles— saw the second-highest levels of Industrial asset appreciation last year, with prices growing by 20.8% year-over-year.16 Moreover, the Inland Empire finished 2021 with the seventh-highest occupancy rate (96.4%) of all tracked markets.17 Ventura and Los Angeles follow as the eighth and ninth-highest Industrial occupancy rates in the country, reflecting overall strength throughout the Greater Los Angeles area. According to David Rich of SVN | Rich Investment Real Estate Partners, “Industrial remains the healthiest commercial real estate sector in Los Angeles – outperforming even multifamily in terms of price and rent appreciation.” Mr. Rich goes on to note that in Los Angeles, “demand is expected to continue into [mid-2022], due in
large part to accelerated online consumer consumption from the COVID economy.”
In NAIOP’s Q1 2022 Forecast Report, the researchers note that concerns over future space needs in the future are spurring competition for
available space today. In dense markets such as the metropolitan areas surrounding New York and Los Angeles, where space is limited, the effect
is bottlenecking of prices. These observations are shared by Mr. Rich, who remarks that “area growth restrictions and increased developments
costs [in Los Angeles] will contribute to strong property values and rental rates beyond 2022.”
THE WESTERN EDGE OF EASTERN TIME
Head west a few hundred miles from the eastern seaboard, and you’ll run into an inter-region set of markets that all straddle similar longitudes.
Markets such as Atlanta, Knoxville, and Columbus may not share much in common other than their time zones, but they all stood out as top
performers in the Industrial sector last year.
Columbus, OH, was one of the most consistent booming Industrial markets in 2021, posting the tenth highest increase in market rents (+11.8%)
and the tenth highest increase in Industrial occupancy rates (+2.7 percentage points).18 Doug Wilson of SVN | Wilson Commercial Group, LLC
notes that “the definition of “’Industrial real estate”’ is evolving rapidly in Columbus. There are few industrial operations any more here, but
there are many distribution centers. And those are complemented by the prevalence of massive fulfillment centers. And add to that, large data
centers to round out the new wave of industrial “sized” properties populating this market. The construction pipeline of speculative industrial
buildings is surging to about 13–15 million SF, while vacancy is a mere 2%-3%.”
Atlanta posted significant Industrial sector rent increases in 2021, coming in at the fifth-highest annual increase in the country.19 Closing out last year, according to CoStar, Industrial space in Atlanta was renting for an average of $7.26 per square foot— an increase of 12.7% year-over-year.20 No market had a higher occupancy rate than Knoxville, TN, in Q4 2021, coming in at a stellar 99.0%.21
15. CoStar; Through Q4 2021. Note: Measured across the top-100 markets
16. CoStar; Through Q4 2021. Note: Measured across the top-100 markets
17. CoStar; Through Q4 2021. Note: Measured across the top-100 markets
18. CoStar; Through Q4 2021. Note: Measured across the top-100 markets
19. CoStar; Through Q4 2021. Note: Measured across the top-100 markets
20. CoStar; Through Q4 2021. Note: Measured across the top-100 markets
21. CoStar; Through Q4 2021. Note: Measured across the top-100 markets
Macro Economy
ECONOMIC GROWTH
The US economy has experienced a robust recovery from the initial shock of
COVID-19. A pandemic-driven shift in consumption away from services and into
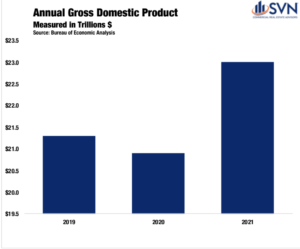
goods, boosted by a sweeping stimulus effort, reconditioned our economy well before an off-ramp from the public health crisis was in sight. By Q3 2020, inflation-adjusted GDP shrugged off its worst quarterly performance on record to record its best, a 33.4% annualized growth rate.1 In 2021, the total nominal value of all consumption and production reached $23.0 trillion, a 9.1% increase above 2020’s total and 6.9% above 2019’s total. After adjusting for inflation, the US economy is 3.2% larger than its pre-pandemic peak.2
The foundation of the economy’s rebound has been a swift labor market recovery. At its April 2020 peak, the official unemployment total reached a staggering 23 million people.3 By the start of 2021, the unemployment total had improved to just 10.1 million people out of work.4 Over the past year, this level has come down to 6.5 million people, less than one million above the pre-pandemic level of 5.7 million.5
INFLATION & MONETARY POLICY
One year ago, the market consensus was that the Federal Open Market Committee (FOMC) would not begin a monetary policy tightening cycle until 2023. However, as demand surges in the face of gummed-up supply chains, rampant inflation has emerged at center stage, forcing shifting guidance from policymakers.
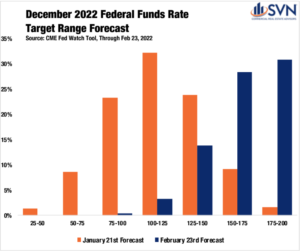
After decades of tepid price increases, in January 2022, the Consumer Price Index (CPI) reached 7.5%, a level not seen in 40 years.6 Core-PCE, the Federal Reserve’s preferred inflation gauge that excludes food and energy prices, reached 5.2% in January, prompting the FOMC to be increasingly committed to an interest-rate hike at its March 2022 meeting.7 In just 24 months, policymakers at the Federal Reserve have repositioned themselves from a tighter monetary policy stance into an accommodative one and back to a tightening one. According to the CME Fed Watch Tool, as of February 23rd, future markets are forecasting seven rate hikes by the end of the year — a sizable shift from even just one month earlier, when future markets were forecasting just four rate hikes in 2022. Volatile swings in the medium-term outlook are symptomatic of the rapid shifts in economic activity that categorized the past two years.
In December, Fed officials looked on cautiously at the near-term outlook as Omicron emerged as a roadblock to economic normalcy. After the Delta variant led to declining activity and sluggish job growth in mid-to-late summer 2021, some officials worried that Omicron, a more transmissible variant of COVID compared to previous waves, would hinder the recovery. While a significant wave of US cases followed, the Omicron wave proved to be less deadly and less straining on the US public health system than previous ones. As a result, an increasing number of US states and municipalities are relaxing masking and vaccine restrictions. On February 25th, the CDC introduced a new slate of guidelines that experts say shifts the US into the “endemic phase” of the pandemic. The new guidelines would put more than half of US counties and over 70% of the population in “low” or “medium” risk designations, bolstering the FOMC’s willingness to remove accommodative monetary policies.
THE GREY AREAS
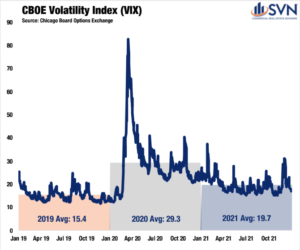
Still, a measurable dose of uncertainty overhangs stock markets and the whole macroeconomy. The VIX, a volatility index captured by the Chicago Board Options Exchange, has remained stubbornly elevated since the onset of the pandemic. Despite moderately retracting during the fall of 2021, the annual average for the VIX in 2021 was 19.7, 27.7% above its 2019 average.8
1. US Bureau Economic Analysis
2. US Bureau Economic Analysis
3. US Bureau Labor Statistics
4. US Bureau Labor Statistics
5. US Bureau Labor Statistics
6. US Bureau Labor Statistics
7. US Bureau of Economic Analysis
8. Chicago Board Options Exchange
About SVN
SVN International Corp. (SVNIC), a full-
service commercial real estate franchisor of the SVN® brand, is one of the industry’s most recognized names based on the annual Lipsey Top Brand Survey. With nearly 200 locations serving 500 markets, SVN provides
sales, leasing, corporate services and property management services to clients across the globe. SVN Advisors also represent clients
in auction services, corporate real estate, distressed properties, golf & resort, hospitality, industrial, investment services, land, medical, multifamily, office, retail, self-storage and single tenant investments. All SVN offices are independently owned and operated.
For more information, visit www.svn.com/.
Look for all of the 2022 Commercial Asset Class Reports at southlandcommercial.com (linked below).
Multi-family Commercial Asset Class Report
Retail Commercial Asset Class Report
Office Commercial Asset Class Report
Industrial Commercial Asset Class Report
View all current SVN Southland listings here.
« Previous Next »


