admin / February 15, 2022
Commercial Real Estate Asset Class – Multifamily
Multifamily Commercial Real Estate Asset Class Report
Contents
- National Overview
- Financial Performance
- Markets Making Headlines
- Macroeconomy
- About SVN
Commercial Real Estate Asset Class: Office – (Download Full PDF)
National Overview
“Your home is your castle.” – Sir Edward Coke (1604)
The esteemed Sir Coke may not have had the foresight to
envision Netflix binge sessions or DIY arts and crafts on YouTube, but it didn’t change just how relevant his four-century-old quote would be in 2020. The Multifamily sector certainly took its fair share of COVID-related pain, as did most
sectors not named Industrial. Still, on balance, apartment properties generally maintained solid footing through 2020, outperforming worst-case scenarios by a wide margin.
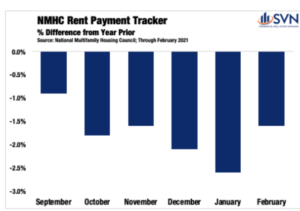
Once the shutdown shuttered businesses and sent 14% of the workforce into unemployment, there were rising concerns that en masse renters would fall behind on their monthly obligations. According to the National Multifamily Housing Council’s Rent Tracker, initial fears have not been realized as collections have held up reasonably well. The rent tracker, which follows the performance of more than 11 million professionally managed apartments, indicates that 93.5% of renter households paid rent in February—only a 1.6% drop off from the same month last year.
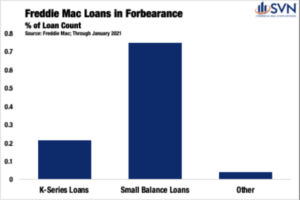
These data, however, likely understate some sector-level underperformance, as they do not include vacant units or self-managed “mom-and-pop” properties. According to Freddie Mac’s latest forbearance report, we know that small balance originations, which tend to cater to the “mom-and- pop” investor class, make up 75% of loans in forbearance.
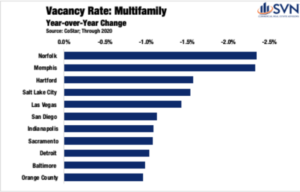
For centrally located assets, especially those in major markets, rising vacancies created by an imbalanced flow of residents proved to be the biggest weakness of 2020. While the active choice of renters leaving cities was a frequently covered news story last year, according to the Cleveland Federal Reserve Bank, the implied choice of renters deciding not to move to cities was more impactful.
While operational concerns were COVID’s constant headwind, they were partially offset by declining benchmark interest rates and rising asset valuations. All else equal, except for suburban Multifamily and Single-Family Rentals, most apartment operators experienced a mixed bag of results in 2020. With recoveries already reportedly underway in many of last year’s worst-performing markets, 2021 is positioned as a year of either continued growth or nascent recovery, depending on local market dynamics.
Financial Performance
MULTIFAMILY TRANSACTION VOLUME
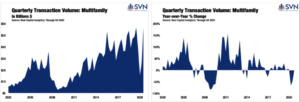
Transaction volumes in the Multifamily sector went on a wild ride in 2020, complete with vertical drops and a launch-pad ascending recovery. In 2019, annual transaction volume tracked by Real Capital Analytics totaled $192B, with Q4 2019 alone posting just shy of $57B— both of which were all-time highs. As COVID sent Americans indoors, the appetite for investors to enter the market at pre-shutdown prices was all but nonexistent. In Q2 2020, quarterly transaction volumes fell to just $15.5B, the lowest level since 2011. The second quarter drop-off represented a 67.2% year-over-year decline. As the US economy normalized and adjusted to the new COVID reality, the daylight between buyer offers and seller demands has started to shrink, allowing the resumption of trades. As of Q4 2020, quarterly transaction volume totaled $56.7B, just 0.1% below the all-time high. Several market-defining features made Multifamily’s rapid return to healthy transaction activity possible, with the presence of the agencies acting as a liquidity safeguard and the dependability of underlying demand standing as front-of-mind examples. The year-end tally for 2020 brings the total annual transaction volume to $138.7B, a 27.6% year-over-year decline.
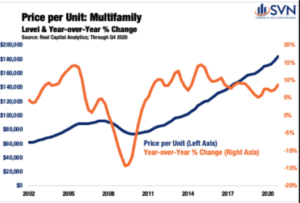
CAP RATES AND PRICING
Cap rates for Multifamily properties continued to edge down in 2020— a symptom of cratering benchmark interest rates and the sector’s prevailing perception as low-risk. According to Real Capital Analytics’ hedonic estimates, cap rates for apartment properties averaged 5.1% in Q4, down 6 bps from the previous quarter. Further, between Q4 2019 and Q4 2020, cap rates sank a total
of 20 bps, settling down at a new all-time low.
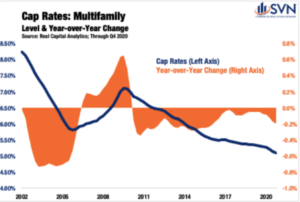
Declining cap rates have meant upward pressure on pricing, even as uncertainty gripped the market and led to fewer voluntary trades. The average valuation of an apartment unit in Q4 2020 totaled $183,416, up 3.5% quarter-over-quarter and up 8.5% from one year ago.
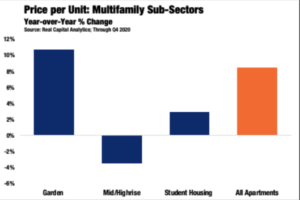
Across subsectors, pricing trends in 2020 penalized density and rewarded suburban expansion. Mid-rise and high-rise properties saw their values sink by 3.5% year-over-year.5 Garden apartments, however, recorded a banner-year as unit prices surged by 10.7%.6 Student Housing, a relatively small niche that only accounted for a little more than 4% of the sector’s transaction volume, posted modest price gains of 2.9% year-on-year.
Market Making Headlines
FLORIDA: HOT EVEN BEFORE TOM BRADY
Several hotspots within Florida are continuing to see positive momentum. While the Sunshine State enjoyed strong domestic in-migration before the pandemic, COVID has turned up the water pressure on the incoming flow.
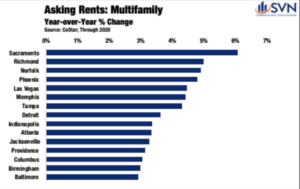
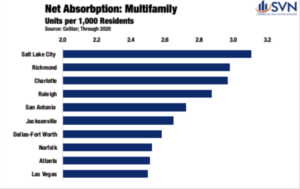
The Tampa Bay Area is a notable standout. According to CoStar, Tampa posted the seventh-highest increase in Multifamily asking rents of all major markets, growing 4.3% year-over-year. Vacancy rates in Tampa entered 2020 at 6.5% and improved to 5.9% through Q4.8 Further, total net absorption improved 21% year on year in 2020, rising to 6,293 units.
The MSAs surrounding Tampa also appear to be enjoying a degree of radial success.
Home prices in the Tampa-St.Petersburg, Lakeland, and North Port-Sarasota areas are all outperforming the national average. According to the FHFA’s All Transaction Home Price Index, on average, US home prices finished the year up 6.0% from the end of 2019. The North Port- Sarasota-Bradenton MSA outperformed the national average by 1.2%, posting a 7.2% annual growth rate through Q4 2020. The Tampa-St. Petersburg- Clearwater MSA outperformed the national average by a slightly better 2.6% and recorded an 8.2% price jump. According to Larry Starr, Managing Director of SVN | Commercial Advisory
Group, pricing pressures are rapidly rising due to an “unprecedented amount of people relocating to Southwest Florida, and the lack of home inventory.” The excess demand over available supply is leading to record-high occupancy rates,
healthier NOIs and lower overall cap rates. “Simply put, the Southwest Florida Multifamily asset class has become one of the most sought after commercial real estate investments in our region.”
The Lakeland-Winter Haven MSA saw a feverish increase in house prices to finish the year, beating the national average by a whopping 4.1% and finishing the year up 10.1%. According to Gary M. Ralston, Managing Director of SVN | Saunders Ralston Dantzler Real Estate, “the Lakeland-Winter Haven MSA, which
corresponds to Polk County, is growing by almost 18,000 people per year,” resulting in “apartment demand of over 4,000 units per year.” Ralston notes that “supply has not kept pace and as a result, occupancy is very high, and rents are increasing.” He goes on to add that Lakeland’s growing magnetism is attributable to the fact that it is “very attractive to working couples. Being in the middle of the I-4 corridor, between Tampa and Orlando, means that one could work in Orlando and the other could work in Tampa.”
Drive 200 miles northeast, and you’ll find another Florida metro starting to punch above its weight: Jacksonville (if you start seeing peach trees, you’ve gone too far). The future home of Trevor Lawrence has seen its resident population grow more quickly than the national average every year since 2010. As of 2019, Jacksonville’s resident population was growing at an annual clip of 1.75%— 3.6x the paltry 0.48% measured nationally for the same period.
Healthy levels of population growth are contributing to equally robust net absorption totals. For the year that was 2020, the Multifamily sector absorbed 4,128 units in Jacksonville, a 70% bump-up from 2019.
According to the Director of Acquisitions for the Laramar Group, a national real estate investment and management firm that recently acquired a 600+ unit Multifamily asset in the area, “Jacksonville is an attractive Multifamily market due to its strong demographics, diverse workforce, and growing concentration of employers in the Financial, Healthcare, Manufacturing and Logistics sectors.”
DEAR LA, SF, AND NYC: THANK YOU. YOURS TRULY, EVERYONE ELSE
In economics, when two or more parties interact with one another, either it is a story of mutual benefit or a zero-sum game. As the coastal gateway markets can attest, 2020 was a year of the latter. According to a MyMove analysis of USPS change of address requests, between February and July 2020, a cumulative 153,984 residents up and left Manhattan and Brooklyn.13 Following behind NYC are Chicago, San Francisco, and Los Angeles, which had each lost roughly 31k, 27k, and 26k residents, respectively. The MyMove report notes that 8 of the 10 most moved out of cities in 2020 made the list of top move-outs the year prior as well, suggesting that pandemic has metastasized trends that are pushing residents out of dense urbanities.
In terms of Multifamily success, these trends are creating a wide number of winners and losers. Los Angeles and San Francisco are acting as feeder cities throughout the West. According to Apartment List’s Q4 Migration Report, 17.3% of outbound apartment searches in LA are targeting Phoenix, AZ.14 Hidden by its mountainous surroundings, The Valley of the Sun’s major-market status is often lost on those with a coastal bias, to put it politely. Despite standing as the fifth-most populous US city, it remains a bargain compared to its California
counterparts. Even after accounting for asking rent growth of 4.8% in 2020, Phoenix remains 37% less expensive than Los Angeles and 55% less expensive
than San Francisco.15 “The Phoenix Metro Multifamily market has seen tremendous growth over the last 10+ years,” says Perry Laufenberg, Managing Director of SVN | Desert Commercial Advisors. “Converging factors, including population growth, job growth, wage growth, and single-family price appreciation have helped push apartment rental rates and occupancy rates to historical highs. Pandemic-related population shifts have only seemed to amplify these trends, as Arizona ranks at or near the top in residents gained during the
last year.”
Las Vegas, Reno, Sacramento, San Diego, and Albuquerque all stand out as secondary markets enjoying success at the expense of residents leaving more expensive alternatives. In Albuquerque specifically, “combined with the already tight Apartment market,” the closure of the Student Housing at the University of
New Mexico has “forced students to find housing off campus,” inflating occupancy rates to record-highs, remarks Walt Arnold, Managing Director of SVN | Walt Arnold Commercial Brokerage, Inc. Multifamily vacancy rates in Las Vegas fell from 7.2% in Q4 2019 to 5.8% in Q4 2020, lifting asking rents by 4.5% in the process. Nearby Reno had a similar experience, with asking rents climbing
by 5.4%.
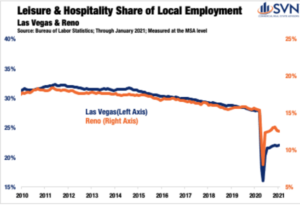
Notably, the two metros with a reputation for their reliance on the Hospitality sector have gone a long way in diversifying their workforces over the past decade. Between 2010 and February 2020, the month before the start of the domestic outbreak, the share of workers in Las Vegas working in Hospitality
and Leisure fell from 31.4% to 28.2%. Similarly, over the same period, the share fell from 17.7% in Reno to 15.6%.
According to Gerrit Hillebrand, Senior Advisor at SVN| Gold Dust Commercial Associates, Reno/Sparks and Carson are all attracting “West Coast investors looking to place capital…with a significant percentage coming from California.”
He adds that “each month brings new high watermarks in Multifamily values, driven by economic turmoil in neighboring states and the proposed removal of
the 1031 exchange by the new administration.” The Apartment sector continues to outperform in Northern Nevada, despite the high volume of supply scheduled
for delivery in early 2022. While prices have risen to levels that shock local investors, for many out of market buyers, Reno/Sparks inventory offers price points at a low barrier to entry.”
Moving from the West Coast to the East, secondary markets across the seaboard are gaining momentum. Nestled commuting distance from Washington DC, both Richmond and Baltimore are stealing large swaths of migrating demand away from the Nation’s Capital. Rents in Richmond and Baltimore rose by 5.0% and 2.9% year-over-year, standing in stark comparison to the 3.9% decline measured across Washington DC.
Macroeconomy
Economic Growth
The total value of all final sales of goods and services, investments, government expenditures, and net exports came out to a little more than $20.9T in 2020. After adjusting for inflation, 2020’s report card represents a 3.5% drop off from production and consumption levels measured in 2019.
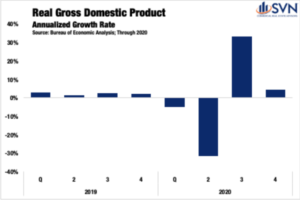
Of course, a marginal, single-digit percent change snapshot fails to capture the violent swings in economic activity recorded across quarters. In Q1 2020, while risks of a global pandemic were rising, the US economy seemingly continued along an autopilot-glide. It wasn’t until the last two weeks of the quarter that Times Square started to resemble the scenes out of a Stephen King novel.
For the quarter, annualized GDP growth came in at -5.0%, a harbinger of the pain to come. In the second quarter, a period defined by the worst days of the pandemic, the US economy shrank at a -31.4% annualized rate, the worst reading ever. In Q3, the resumption of some normalcy fueled the highest quarterly GDP figure on record at 33.4%. As the cold weather started to settle in during Q4, growth again started to cool. For the final period of Q4, the US economy expanded at just a 4.3% annualized rate.
In January 2020, the Congressional Budget Office released estimates for its expectations of growth in the then year ahead.2 The $22.1T forecast serves as an estimate of where the US economy would have finished the year had the pandemic not reached our shores. The shortfall between actual and forecasted GDP totaled $1.2T. While these figures may sound abstract, understanding them in terms of average wealth lost per person makes the drop off more appreciable. On average, every US citizen is $3,560.06 worse off through the end of 2020 compared to a version of the past year where COVID did not exist.
With serotonin levels now surely in low supply, there is, at least, significant hope that 2021 will be a year of earnest recovery. As of the March WSJ Economic Forecasting Survey, on average, leading economists expect the US economy
to grow by 6.0%. If reality ends up matching expectations, 2021 will mark the fastest annual growth since 1984— the first non-Orwellian reference to that year in some time.
LABOR MARKET
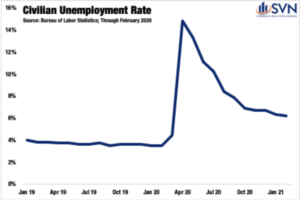
If the US economy were a human body, the labor market would be the beating heart— and in 2020, even the cardiologists were complaining of chest pain. Between February and April, the civilian unemployment rate went from an all-time low of 3.5% to a stratospheric, post- Great Depression high of 14.8%. The national lockdown mimicked a labor market trajectory only previously observed at local levels following natural disasters. Between December 2007 and the start of June 2009, the official start and end dates of the Great Recession, a little more than 37 million people filed for first-time jobless benefits; in 2020, it took just nine weeks to eclipse the same total. From the week ending March 21st, 2020, through the week ending on March 20th, 2021, 82.6 million initial unemployment claims have been filed, exceeding the Great Recession total by 122% and good for roughly one claim for every two Americans in the labor force.
From K-, W- Crooked L-, W-, and V-shaped recoveries, alphabet enthusiasts have had their hands full this past year. After the initial lockdown, labor markets quickly sprang back between May and October, with the unemployment rate falling by 7.9%, landing at 6.9%. Progress has slowed in the months since, with the unemployment rate settling at 6.2% through February 2021. Of course, the nature of losses and improvements has not been felt proportionally across different industries. For workers employed in Financial Services, Government, Agriculture, Education and Health Services, and Manufacturing, employment losses in 2020 ranged from mild to non-existent. On the other side of the spectrum, the Leisure and Hospitality sector continues to battle an industry-level unemployment rate that is 7.8% higher than it was one year ago.
INTEREST RATES & INFLATION EXPECTATIONS
As COVID’s arrival on US shores settled in, Treasuries recalibrated to the dampened outlook, falling to new all-time lows. Treasury rates dipped by more than 100 bps in less than one month, reaching their bottom of 0.54% on March 9th, 2020. By August, a rebound of economic activity and job growth was already underway, allowing for the return of some forward-looking optimism. As vaccine distribution ramps up and the federal government infuses additional stimulus into businesses and households, market expectations have firmed, and Treasury rates have returned to pre-COVID levels.
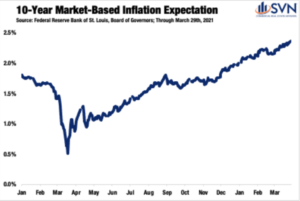
With the possibility of several tailwinds hitting the economy’s sails all at once, some market watchers are beginning to sound the alarm on inflation. Market-based inflation expectations can be measured by taking the difference between 10-Year Treasuries, which are quoted nominally, and 10-Year inflation-adjusted securities, commonly referred to as TIPS. This spread has soared over the past year, reaching 2.36% on March 29th, 2021— the highest level since 2013. With inflation expectations rising, questions over the ‘how’ and ‘when’ the Federal
Reserve might next raise rates have also come to center stage. Nevertheless, Fed Chair Jerome Powell has reiterated that the Central Bank is committed to an accommodative monetary regime, and a rate-hike should not be expected until at least 2023.
ABOUT SVN®
SVN International Corp. (SVNIC) is a full-service commercial real estate franchisor of the SVN® brand. Spanning more
offices in the United States than any other commercial real estate firm, in nearly 200 locations serving 500 markets, and
with continuing global expansion, SVN is one of the industry’s most recognized names. SVN provides sales, leasing,
corporate services and property management services to clients across the globe. SVN Advisors also represent clients
in auction services, corporate real estate, distressed properties, golf & resort, hospitality, industrial, investment services,
land, medical, multifamily, office, retail, self-storage and single tenant investments. All SVN offices are independently
owned and operated. For more information, visit www.svn.com/.
Look for all of the 2022 Commercial Asset Class Reports at southlandcommercial.com (linked below).
Multi-family Commercial Asset Class Report
Retail Commercial Asset Class Report
Office Commercial Asset Class Report
Industrial Commercial Asset Class Report
View all current SVN Southland listings here.
« Previous Next »


