admin / April 18, 2022
Commercial Real Estate Asset Class – Retail
Contents
- National Overview
- Financial Performance
- Markets Making Headlines
- Macroeconomy
- About SVN
Commercial Real Estate Asset Class: Retail – (Download Full PDF)
National Overview
THE RETAIL SECTOR
was already steeped in transformational shakeout prior to the pandemic, rightsizing to how shopping is done in an increasingly digital economy. In what has already been a decade-long process, most analysts thought it would be a decade more before we started to see a turnaround. Of course, the pandemic has updated those timelines dramatically. SVN® Retail Product Chair Ryan Imbrie, CCIM notes that the retail sector “landed on the unfavorable side of COVID-19’s lopsided impact on commercial real estate.” While industrial properties benefited from the surge in online spending, Imbrie says the pandemic advanced the retail sector’s “long slide” with mounting store closings and rising vacancy.
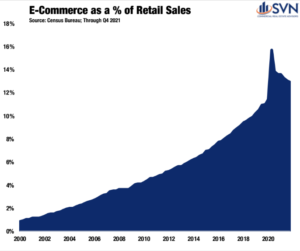
As the old Winston Churchill quote goes, “If you’re going through hell, keep going.” In 2020, with physical restrictions on retail in place, a significant portion of retailing shifted from in-person to online. E-commerce’s share of retail sales has grown by an average of 0.5 percentage points annually since the start of the millennium, but between Q1 and Q2 2020, it shot up from 11.4% to 15.7%1— quantitative proof thatAmericans were not only buying toilet paper and DIY arts and crafts during the shutdown. Thankfully for the Retail sector, shoppers returned to the aisles in late 2020 and continued doing so throughout 2021. Through Q4 2021, e-commerce’s share of retail sales has fallen down to 12.9%.2
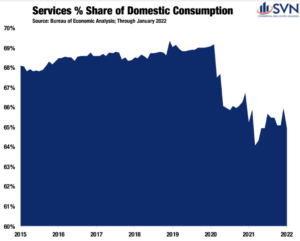
Overall, monthly retail sales reached their highest level on record in January 2022, coming in at a seasonally adjusted $650 billion for the month.3 The sector “has experienced some bright spots where tenants are thriving as seen in grocery-anchored properties, home improvement, and dollar stores,” remarks Mr. Imbrie. Over the short term, the sector should continue to benefit from an apparent shift away from services and towards the consumption of physical goods that have remained present even as the country has lifted most pandemic-era restrictions.
The Retail sector was often compared to a patient on life support heading into the pandemic, and the shock of the shutdown was widely thought to be a knockout blow. Interventions by the Federal Government, namely the Payroll Protection Program, helped to limit the scale of distress. According to Trepp, levels of distress in the sector continue to improve, though investors remain cautious. Through January 2022, the CMBS delinquency rate has improved to 8% — down from 18% during the pandemic’s crisis peak, though still above the sub-4% level where it was entering 2020.4
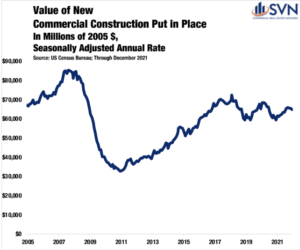
Still, for the first time in a long time, having a healthy dose of optimism for the Retail sector feels appropriate. According to OpenTable’s COVID recovery tracking, the US is arriving right back at its pre-pandemic benchmark for restaurant reservations almost two years after the initial shut down. Moreover, after adjusting for inflation, the value of new commercial construction put in place, a broad category that includes most retail and wholesaling activities, has trended downward since 2018. With less new supply entering the Retail sector, the macro task of repositioning existing stock becomes a bit less herculean. Retail may not be out of the woods just yet, but after following Mr. Churchill’s advice, the temperature dial is starting to improve.
1. US Census Bureau
2. US Census Bureau
3. US Census Bureau
4.https://www.trepp.com/hubfs/Trepp%20Retail%20Report%20February%202022.pdf?hsCtaTracking=8cec15d8-2d6d-4a7e-
b3be-47518c19f0f8%7C7edd6f4f-a67b-476b-aaec-43ab495ce73c
Financial Performance
TRANSACTION VOLUME
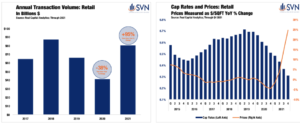
Transaction volumes in the retail sector surged in 2021, following a trend observed throughout all commercial real estate. According to Real Capital Analytics, deal volume for retail assets reached $76.8 billion last year — an 88% improvement from 2020’s pandemic-muted total and 14.1% better than 2019’s mark.5 While new deal activity in 2021 remained down from 2015’s record peak by $13.5 billion, last year saw the most retail deal volume since 2018.6
As was the case in 2020, the Retail sector was a mixed bag of outcomes across its sub-property types. Big Box Retail assets saw a resurgence as new deal activity rose by 88% to $2.6B — roughly equivalent to 2019’s and 2020’s totals combined.7 Lifestyle/Power Centers also saw a large uptick in 2021, posting $5.8 billion of deal volume, marking its highest total since 2014.8 Mall assets have continued to see deal volumes crater as the maligned product type posted just $1.9 billion of trades last year, declining 51% from 2020.9 Drug store assets saw muted growth in 2021 as deal volume grew year-over-year by just 19%.10 However, Drug Store’s lackluster (by comparison) growth total is a function of the product type’s success in 2020, as it was the only asset type seeing investment growth during the pandemic slowdown.
CAP RATES AND PRICING
Cap rates for Retail properties continued to post declines in 2021. Through Q4 2021, cap rates are down 6 bps from Q3 and 20 bps from the same time last year.11 Again, retail sub-types saw dramatically idiosyncratic cap rate movements through 2021. Unsurprisingly, Malls were the only sub-asset type to post rising property yields in 2021, growing 47 bps year-over-year through Q4 2021.12 Grocery-anchored followed next, with the property type posting just 11 bps of cap rate compression last year.13 On the other side of the spectrum are Anchored and Big Box retail assets, which posted cap rate compression totals in 2021 of 42 bps and 49 bps, respectively.14
On the pricing front, retail assets across the board saw improving trading valuations in 2021. The average year-over-year price appreciation for all retail assets through Q4 2021 was 24.7%.15 Moreover, retail assets generally are trading at valuations 19.0% above where they stood pre-pandemic and 18.1% above their previous all-time high (2016).16 The best performing retail sub-types by price appreciation in 2021 were Centers and Unanchored assets, which saw valuations grow by 30.5% and 22.6%, respectively.17
5. Real Capital Analytics; Through Q4 2021
6. Real Capital Analytics; Through Q4 2021
7. Real Capital Analytics; Through Q4 2021
8. Real Capital Analytics; Through Q4 2021
9. Real Capital Analytics; Through Q4 2021
10. Real Capital Analytics; Through Q4 2021
11. Real Capital Analytics; Throughout Q4 2021
12. Real Capital Analytics; Throughout Q4 2021
13. Real Capital Analytics; Throughout Q4 2021
14. Real Capital Analytics; Throughout Q4 2021
15. Real Capital Analytics; Throughout Q4 2021
16. Real Capital Analytics; Throughout Q4 2021
17. Real Capital Analytics; Throughout Q4 2021
Markets Making Headlines
THE SUNBELT EXPANSION
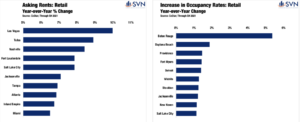
From the coastlines of Florida to the outskirts of the Colorado River, the retail sector in the Sun Belt is cashing in on consumers migrating into the Southern portion of the country. Positive momentum is stretching across state lines and time zones. Nashville closed out 2021 as one of the nation’s top-performing retail markets, posting the third-highest annual rent growth totals (8.4%).18 While Nashville is heralded as the music capital of the country, its tech sector is singing the sweetest tunes of all. Nashville’s expanding tech base is forecast to double
the metro’s employment growth rate in the coming years,19 bringing more residents into the area and putting additional upward pressure on available space. Las Vegas, another entertainment industry heavyweight that has cultivated its tech sector, is experiencing a similar trajectory of success. Retail market rents in Sin City finished up 10.0% to close out 2021, the top mark in the country.20
Three of the four largest increases in Retail occupancy last year were found in the Sun Belt — two of which were in Florida.21 Baton Rouge, LA led the entire country with the largest one-year occupancy rate increase.22 Between Q4 2020 and Q4 2021, occupancy rates in Baton Rouge jumped from 91.4% to an extremely tight 96.8% — an improvement of 5.4 percentage points.23 Moving down the list, Daytona Beach, FL, posted an occupancy rate improvement of 1.9 percentage points, and Fort Myers, FL, rose by 1.4 percentage points.24 Commenting on the Daytona Beach and Ormond Beach area, Carl Lentz of SVN | Alliance Commercial Real Estate Advisors notes that “explosive residential growth and retail traction along the LPGA corridor have been the primary drivers of the momentum.” While warm winters are a consistent selling point
throughout the Sunshine State, Daytona’s retail sector has also benefited from its proximity to the region’s booming blend of suburban amenities, a dominating feature of post-pandemic real-estate growth.
Mr. Lentz goes on to mention that “as local and regional retailers continue to see success, many national retailers are paying attention and
entering the market.”
18.CoStar; Through Q4 2021. Note: Measured across the top-100 markets
19. https://technologycouncil.com/wp-content/uploads/2021/11/2021-State-of-Middle-TN-Tech.pdf?utm_source=Sailthru&utm_
medium=email&utm_campaign=2021.11.22%20NASH&utm_term=NASHtoday%20Subscribers%20-%20MASTER
20. CoStar; Through Q4 2021. Note: Measured across the top-100 markets
21. CoStar; Through Q4 2021. Note: Measured across the top-100 markets
22. CoStar; Through Q4 2021. Note: Measured across the top-100 markets
23. CoStar; Through Q4 2021. Note: Measured across the top-100 markets
24. CoStar; Through Q4 2021. Note: Measured across the top-100 markets
Macro Economy
ECONOMIC GROWTH
The US economy has experienced a robust recovery from the initial shock of
COVID-19. A pandemic-driven shift in consumption away from services and into
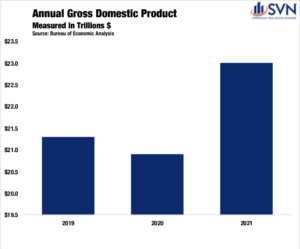
goods, boosted by a sweeping stimulus effort, reconditioned our economy well before an off-ramp from the public health crisis was in sight. By Q3 2020, inflation-adjusted GDP shrugged off its worst quarterly performance on record to record its best, a 33.4% annualized growth rate.1 In 2021, the total nominal value of all consumption and production reached $23.0 trillion, a 9.1% increase above 2020’s total and 6.9% above 2019’s total. After adjusting for inflation, the US economy is 3.2% larger than its pre-pandemic peak.2
The foundation of the economy’s rebound has been a swift labor market recovery. At its April 2020 peak, the official unemployment total reached a staggering 23 million people.3 By the start of 2021, the unemployment total had improved to just 10.1 million people out of work.4 Over the past year, this level has come down to 6.5 million people, less than one million above the pre-pandemic level of 5.7 million.5
INFLATION & MONETARY POLICY
One year ago, the market consensus was that the Federal Open Market Committee (FOMC) would not begin a monetary policy tightening cycle until 2023. However, as demand surges in the face of gummed-up supply chains, rampant inflation has emerged at center stage, forcing shifting guidance from policymakers.
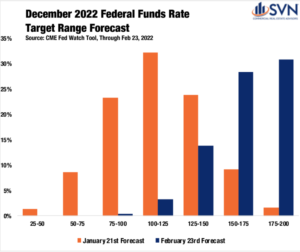
After decades of tepid price increases, in January 2022, the Consumer Price Index (CPI) reached 7.5%, a level not seen in 40 years.6 Core-PCE, the Federal Reserve’s preferred inflation gauge that excludes food and energy prices, reached 5.2% in January, prompting the FOMC to be increasingly committed to an interest-rate hike at its March 2022 meeting.7 In just 24 months, policymakers at the Federal Reserve have repositioned themselves from a tighter monetary policy stance into an accommodative one and back to a tightening one. According to the CME Fed Watch Tool, as of February 23rd, future markets are forecasting seven rate hikes by the end of the year — a sizable shift from even just one month earlier, when future markets were forecasting just four rate hikes in 2022. Volatile swings in the medium-term outlook are symptomatic of the rapid shifts in economic activity that categorized the past two years.
In December, Fed officials looked on cautiously at the near-term outlook as Omicron emerged as a roadblock to economic normalcy. After
the Delta variant led to declining activity and sluggish job growth in mid-to-late summer 2021, some officials worried that Omicron, a more
transmissible variant of COVID compared to previous waves, would hinder the recovery. While a significant wave of US cases followed, the
Omicron wave proved to be less deadly and less straining on the US public health system than previous ones. As a result, an increasing
number of US states and municipalities are relaxing masking and vaccine restrictions. On February 25th, the CDC introduced a new slate
of guidelines that experts say shifts the US into the “endemic phase” of the pandemic. The new guidelines would put more than half of US
counties and over 70% of the population in “low” or “medium” risk designations, bolstering the FOMC’s willingness to remove accommodative
monetary policies.
THE GREY AREAS
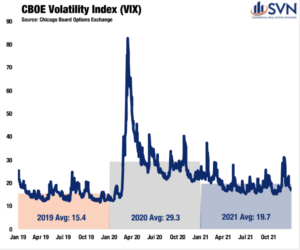
Still, a measurable dose of uncertainty overhangs stock markets and the whole macroeconomy. The VIX, a volatility index captured by the Chicago Board Options Exchange, has remained stubbornly elevated since the onset of the pandemic. Despite moderately retracting during the fall of 2021, the annual average for the VIX in 2021 was 19.7, 27.7% above its 2019 average.8
1. US Bureau Economic Analysis
2. US Bureau Economic Analysis
3. US Bureau Labor Statistics
4. US Bureau Labor Statistics
5. US Bureau Labor Statistics
6. US Bureau Labor Statistics
7. US Bureau of Economic Analysis
8. Chicago Board Options Exchange
About SVN
SVN International Corp. (SVNIC), a full-service commercial real estate franchisor of the SVN® brand, is one of the industry’s most recognized names based on the annual Lipsey Top Brand Survey. With nearly 200 locations serving 500 markets, SVN provides sales, leasing, corporate services and property management services to clients across the globe. SVN Advisors also represent clients in auction services, corporate real estate, distressed properties, golf & resort, hospitality, industrial, investment services, land, medical, multifamily, office, retail, self-storage and single tenant investments. All SVN offices are independently owned and operated.
For more information, visit www.svn.com/.
Look for all of the 2022 Commercial Asset Class Reports at southlandcommercial.com (linked below).
Multi-family Commercial Asset Class Report
Retail Commercial Asset Class Report
Office Commercial Asset Class Report
Industrial Commercial Asset Class Report
View all current SVN Southland listings here.
« Previous Next »


