admin / February 22, 2022
Commercial Real Estate Asset Class – Industrial
Commercial Real Estate Asset Class – Industrial
Contents
- National Overview
- Financial Performance
- Markets Making Headlines
- Macroeconomy
- About SVN
Commercial Real Estate Asset Class: Office – (Download Full PDF)
National Overview
If you had lived in New York City during the aftermath of the Great Recession, you would have noticed the seemingly endless trend of old warehouse spaces transforming into chic venues, workspaces, and nightclubs. Millennial crowds
(and their spending dollars) poured into the city, igniting a new Urban Renaissance. It is somewhat mystifying that during the current downturn, the process has gone into reverse.
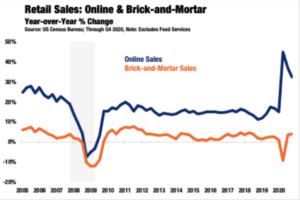
The Industrial sector was a star stand-out of Commercial Real Estate over the past year, absorbing sizable new demand that had grown out of pandemic-shifts in economic priorities. First, the onboarding of testing, tracing, and PPE created
a need for Industrial capacity as necessary production ramped-up. Second, restrictions on in-person activity forced consumers to buy more goods and services online than ever before, creating excess Industrial demand up the supply chain. While other commercial real estate segments showed similar resiliency during the downturn, the gears turning the engine on Industrial indicate a longer-term shift.
As reported by NAREIT, no other core-four property type held up better during the pandemic than Industrial. Between January 2020 (the last month before COVID volatility crept into markets) and February 2021, Industrial REITs posted
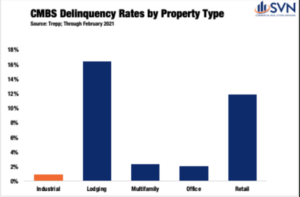
a 7.2% return. Meanwhile, Office, Residential, and Retail REITs all declined by double digits over the same period. Within CMBS, trends are similar. According to Trepp, through February 2021, only 0.88% of Industrial CMBS loans are
delinquent, less than half the rate of the next least distressed property type.
The Board of Governor’s Industrial Production Index, which measures the inflation-adjusted output of manufacturing and extraction-based activities, recovered swiftly through the second half of 2020 and into 2021. After falling by as much as 16.2% year-over-year in April, the index stands down just 1.8% year-over-year through January. Further, the ISM’s February Manufacturing PMI, an index where any reading above 50 indicates expansion, surged 2.1% for the
month, landing at 60.8.
As noted by Moody’s Analytics REIS, even as the vaccine rollout continues and the US eagerly approaches herd immunity, much of the pain felt in the Retail sector cannot be undone, and the Industrial sector’s cannibalization of retail spending is at least partially permanent. Moody’s Analytics REIS forecasts that occupancy growth for warehouse and distribution facilities should continue through this year even as there is an influx of incoming supply, reflecting the sector’s continued strength.
Financial Performance
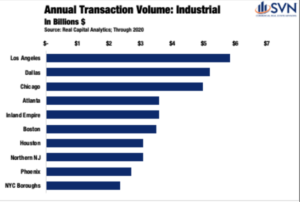
INDUSTRIAL TRANSACTION VOLUME
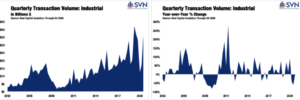
The Industrial sector remained the ‘darling’ of Commercial Real Estate in 2020, though, at least in terms of transaction activity, “best performing” is a title assigned relatively. According to Real Capital Analytics, transaction volume totaled $98.8B for the year, a 15.9% drop-off from 2019. Before the pandemic, the sector’s deal volume was growing at an impressive multi-year clip, with volumes increasing by 25%, 29%, and 19% in 2017, 2018, and 2019, respectively. Deal activity entered the year on solid footing, with Q1 2020 totals growing a momentous 89% year-over-year. However, deal volume slowed considerably through the middle of the year, with quarterly totals registering year-over-year declines of -39.5% and -60.2% in Q2 and Q3, respectively. Transaction activity surged in Q4, jumping 115% quarter-over-quarter and finishing down just -2.1% down from the same period last year.
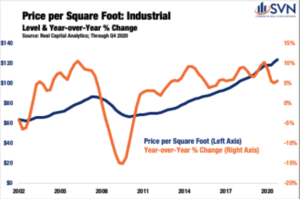
CAP RATES AND PRICING
If observing large swings in cap rates is your idea of fun, the Industrial sector’s prevailing yield structure is about as exciting as getting a root canal on Tax Day.
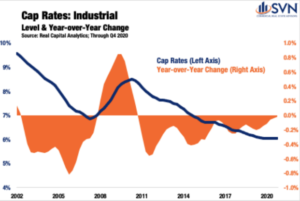
According to Real Capital Analytics’ Hedonic series, cap rates for the industrial sector have now averaged 6.0% for five consecutive quarters.
In Q3, the spread between Industrial cap rates and 10-year Treasuries, the Industrial sector’s return premium, hit its highest rate since 2013, reaching
5.4%. The yield spread declined for the first time in Q4 2020 in a year as the premium fell back down 5.2%. Valuations sustained positive momentum throughout the year. Measured quarterly on a year-over-year basis, price growth ranged from a low of 5.0% (Q3) to a high of 8.5% (Q1). Through Q4, Industrial prices finished the year up by 5.4% over Q4 2019 levels.
While still recording solid gains, Flex Industrial space finished 2020 with the least price growth of all industrial sub-types, posting a 4.5% year-over-year gain through Q4 2020. Single-Tenant assets recorded a weighty 6.3%, and Warehouse assets led all sub-types with price growth hitting 7.4%.
Market Making Headlines
PRIME(D) MARKETS
While centrally located retail in major markets struggled mightily in 2020, the Industrial sectors in those same markets saw a step up in space demand as consumption spending increasingly transitioned to e-commerce fulfillment. Despite posting a 22.5% decline in transaction volume, Los Angeles remained the most liquid Industrial market in the country, registering $5.8B of trades.3 The
adjacent Inland Empire was not far behind on the list, posting the 5th most Industrial transaction volume at $3.6B.4 CoStar reports that through Q4 2020, industrial space in the Los Angeles area maintains the country’s fourth-lowest vacancy rate, sitting at just 3.3%. According to David Rich, Managing Director of SVN | Rich Investment Real Estate Partners, “Industrial remains the healthiest
Commercial Real Estate sector in Los Angeles— outperforming even Multifamily in terms of price and rent appreciation. As we approach the end of Q1, rent growth is on track to increase approximately 5.6% from the first quarter of 2020. Demand is expected to continue into Q2, due in large part to accelerated online consumer consumption from the COVID economy. And area growth restrictions and increased development costs will contribute to strong property values and rental rates beyond 2021.”
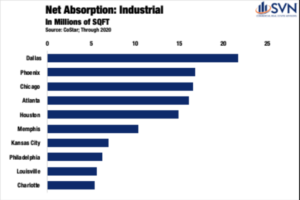
Industrial space in and around Chicago remains in high demand as leasing activity remained healthy during 2020. Just as it had in 2019, net absorption once again topped 16M SQFT. Moreover, for both total new space absorbed and total annual transaction volume, Chicago came in as third on the list for both categories.
Industrial markets that performed well in 2020 tended to have at least one of two characteristics: either they were markets with already large populations, or they
were markets posting high levels of population growth. Dallas and Houston, however, are exceptions that checked both boxes. The two cities came in as the 2nd and 6th most active Industrial markets by transaction volume in 2020, posting $5.2B and $3.1B in trades, respectively.
James Blake, Managing Director of SVN | Trinity Advisors in Fort Worth, notes that “the Dallas-Fort Worth Industrial Market is experiencing unprecedented volume of purchases with record low cap rates and record high transactions.
The wave does not appear to be slowing down with the high occupancies and pressures on rents moving up.” Dallas also holds the crown for the most Industrial space absorbed of any market last year, totaling 21.6M SQFT—
29% more than the second-ranked market, Phoenix. Houston’s net absorption totals did not fall too far behind on the list, ranking at 5th in the country with 14.9M SQFT.
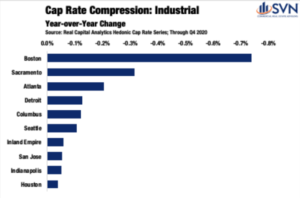
A few Northeastern markets also turned in a solid Industrial report card for this past year. Cap rates in Industrial properties sank by 70 bps in Boston, falling from an average of 6.0% in 2019 to 5.3% in 2020— more than doubling the level of cap rate compression measured in any other market. Falling cap rates helped push up Industrial valuations in the Boston area, rising a feverish 33.8% in 2020, averaging $186 per SQFT.
According to John Parsons of SVN | Parsons Commercial Group, the Industrial market in and around Boston “has seen substantial growth over the last 18 to 24 months.” He goes on to say that “the rental rates have increased close to 25%
in most areas…a direct result of supply and demand. There has been little to no speculative Industrial product added to the market in the last 15 years. In addition to the lack of supply, the demand has skyrocketed from Amazon and other last mile logistic users. The Cannabis industry has also driven the vacancy down in the Industrial market as they are repurposing older Industrial buildings into growing facilities.”
Driven by rising demand for e-commerce distribution, the Industrial market in and around Philadelphia held its strength through 2020 and is positioned well heading into 2021. No market saw rents rise as quickly during 2020 for Industrial space as Philadelphia, where the asking rent per square foot rose by a weighty 7.1%, settling at $7.69 per SQFT.
LOGICAL LOGISTICS
More than a handful of secondary markets popped off the charts as top 2020 Industrial performers. Salt Lake City, another Western metro with a rising investment profile and an attractive balance of affordability, accessibility, and lifestyle, posted strong Industrial space rent growth (5.9% YoY) and net absorption totals (3.9M SQFT).
Chet Barber of SVN | Alta Commercial adds that “the Salt Lake City Industrial market has been running hot for over a decade with vacancies below 5%.” Detailing further, “recently, things have only gotten better. Investors find solid fundamentals with an expanding tenant base in fulfillment, E-commerce, Manufacturing and the Technology sectors.” The average transaction price per square foot also rose in Salt Lake City by a healthy 4.7%.
It is only natural that the tsunami of inflowing residents to the Sun Belt brought their Amazon accounts with them. Nashville had the greatest drop in Industrial vacancy of any US city in 2020, with the rate falling a significant 141 bps.14 The story followed a similar path in another Tennessee metro, Knoxville, where George Brown of SVN | Wood Properties sees that the Industrial market “remains very tight,” a function of “low supply, high demand, and a growing local economy.” Brown continues, “but that hasn’t stopped Amazon, which recently announced a $187 million fulfillment center and $40 million delivery center in the Knoxville area. Land prices have been driven up by subdivision and
multifamily developers, and the nationwide problem of rapidly escalating construction costs exists in Knoxville as well. These factors make it difficult to build new construction with rent rates the marketplace will pay.” Brown goes on to note that he and his team “expect it to be a landlord’s market for quite some time.”
Macroeconomy
ECONOMIC GROWTH
The total value of all final sales of goods and services, investments, government expenditures, and net exports came out to a little more than $20.9T in 2020. After adjusting for inflation, 2020’s report card represents a 3.5% drop off from production and consumption levels measured in 2019.
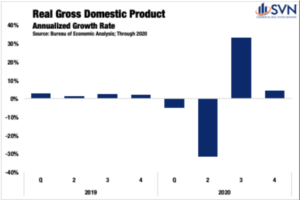
Of course, a marginal, single-digit percent change snapshot fails to capture the violent swings in economic activity recorded across quarters. In Q1 2020, while risks of a global pandemic were rising, the US economy seemingly continued along an autopilot-glide. It wasn’t until the last two weeks of the quarter that Times Square started to resemble the scenes out of a Stephen King novel.
For the quarter, annualized GDP growth came in at -5.0%, a harbinger of the pain to come. In the second quarter, a period defined by the worst days of the pandemic, the US economy shrank at a -31.4% annualized rate, the worst reading ever. In Q3, the resumption of some normalcy fueled the highest quarterly GDP figure on record at 33.4%. As the cold weather started to settle in during Q4, growth again started to cool. For the final period of Q4, the US economy expanded at just a 4.3% annualized rate.
In January 2020, the Congressional Budget Office released estimates for its expectations of growth in the then year ahead.2 The $22.1T forecast serves as an estimate of where the US economy would have finished the year had the pandemic not reached our shores. The shortfall between actual and forecasted GDP totaled $1.2T. While these figures may sound abstract, understanding them in terms of average wealth lost per person makes the drop off more appreciable. On average, every US citizen is $3,560.06 worse off through the end of 2020 compared to a version of the past year where COVID did not exist.
With serotonin levels now surely in low supply, there is, at least, significant hope that 2021 will be a year of earnest recovery. As of the March WSJ Economic Forecasting Survey, on average, leading economists expect the US economy
to grow by 6.0%. If reality ends up matching expectations, 2021 will mark the fastest annual growth since 1984— the first non-Orwellian reference to that year in some time.
LABOR MARKET
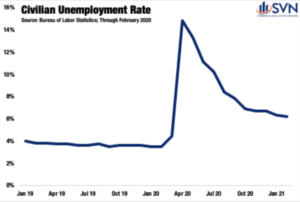
If the US economy were a human body, the labor market would be the beating heart— and in 2020, even the cardiologists were complaining of chest pain. Between February and April, the civilian unemployment rate went from an all-time low of 3.5% to a stratospheric, post-Great Depression high of 14.8%. The national lockdown mimicked a labor market trajectory only previously observed at local levels following natural disasters. Between December 2007 and the start of June 2009, the official start and end dates of the Great Recession, a little more than 37 million people filed for first-time jobless benefits; in 2020, it took just nine weeks to eclipse the same total. From the week ending March 21st, 2020,
through the week ending on March 20th, 2021, 82.6 million initial unemployment claims have been filed, exceeding the Great Recession total by 122% and good for roughly one claim for every two Americans in the labor force.
From K-, W- Crooked L-, W-, and V-shaped recoveries, alphabet enthusiasts have had their hands full this past year. After the initial lockdown, labor markets
quickly sprang back between May and October, with the unemployment rate falling by 7.9%, landing at 6.9%. Progress has slowed in the months since, with the unemployment rate settling at 6.2% through February 2021. Of course, the nature of losses and improvements has not been felt proportionally across different industries. For workers employed in Financial Services, Government, Agriculture, Education and Health Services, and Manufacturing, employment losses in 2020 ranged from mild to non-existent. On the other side of the spectrum, the Leisure and Hospitality sector continues to battle an industry-level unemployment rate that is 7.8% higher than it was one year ago.
INTEREST RATES & INFLATION EXPECTATIONS
As COVID’s arrival on US shores settled in, Treasuries recalibrated to the dampened outlook, falling to new all-time lows. Treasury rates dipped by more than 100 bps in less than one month, reaching their bottom of 0.54% on March 9th, 2020. By August, a rebound of economic activity and job growth was already underway, allowing for the return of some forward-looking optimism. As vaccine distribution ramps up and the federal government infuses additional stimulus into businesses and households, market expectations have firmed, and Treasury rates have returned to pre-COVID levels.
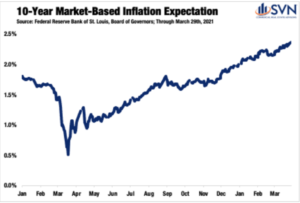
With the possibility of several tailwinds hitting the economy’s sails all at once, some market watchers are beginning to sound the alarm on inflation. Market-based inflation expectations can be measured by taking the difference between 10-Year Treasuries, which are quoted nominally, and 10-Year inflation-adjusted securities, commonly referred to as TIPS. This spread has soared over the past year, reaching 2.36% on March 29th, 2021— the highest level since 2013. With inflation expectations rising, questions over the ‘how’ and ‘when’ the Federal Reserve might next raise rates have also come to center stage. Nevertheless, Fed Chair Jerome Powell has reiterated that the Central Bank is committed to
an accommodative monetary regime, and a rate-hike should not be expected until at least 2023.
ABOUT SVN®
SVN International Corp. (SVNIC) is a full-service commercial real estate franchisor of the SVN® brand. Spanning more
offices in the United States than any other commercial real estate firm, in nearly 200 locations serving 500 markets, and
with continuing global expansion, SVN is one of the industry’s most recognized names. SVN provides sales, leasing,
corporate services and property management services to clients across the globe. SVN Advisors also represent clients
in auction services, corporate real estate, distressed properties, golf & resort, hospitality, industrial, investment services,
land, medical, multifamily, office, retail, self-storage and single tenant investments. All SVN offices are independently
owned and operated. For more information, visit www.svn.com/.
Look for all of the 2022 Commercial Asset Class Reports at southlandcommercial.com (linked below).
Multi-family Commercial Asset Class Report
Retail Commercial Asset Class Report
Office Commercial Asset Class Report
Industrial Commercial Asset Class Report
View all current SVN Southland listings here.
« Previous Next »


