Naveed Hameed / March 28, 2022
Commercial Real Estate Asset Class – Multifamily
Contents
- National Overview
- Financial Performance
- Markets Making Headlines
- Macroeconomy
- About SVN
Commercial Real Estate Asset Class: Multifamily – (Download Full PDF)
National Overview
MULTIFAMILY
Aside from “location, location, location,” the most cliché phrase in real estate may be “people will always need somewhere to live.” Its overuse is a symptom of its accuracy. The Multifamily sector had every excuse available to post a down year in 2021, yet its performance proved to be nothing short of phenomenal. As noted by SVN® Multifamily Chair Reid Bennett, CCIM, the sector faced “unknowns of the pandemic, rent moratoriums, interest rate hike threats, and inflation at a four-decade high.” Nonetheless, markets across the country range from nearly fully recovered to well ahead of where they were two years ago before the pandemic.
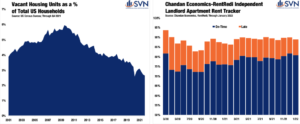
A key reason why rental housing has seen such widespread success in recent years is that the US has undersupplied enough new stock to keep pace with growing demand. Between 2002 and 2010, the amount of vacant housing supply available for sale or rent has typically equaled between 4% and 6% of the total number of US households.1 Through Q4 2021, after more than a decade of declines, this excess housing supply has slumped to just 2.6%. In other words, supply is (very) tight.2
A major concern when the pandemic started was whether renter households would be able to make their monthly payments on time, if at all. According to the NMH rent collections in professionally managed units dipped marginally during the beginning of the pandemic but not enough to be categorized as distress. On the other hand, rental units operated by independent, mom-and-pop landlords proved to be far more sensitive to the shutdown’s economic effects. According to Chandan Economics and RentRedi, on-time rental payments sank by more than 9 percentage points between March and May 2020. Still, despite the pandemic’s multiple waves, 2021 was a year of recovery for small apartment operators. Through January 2022, on-time rent collections were back in line with where they were entering the pandemic.
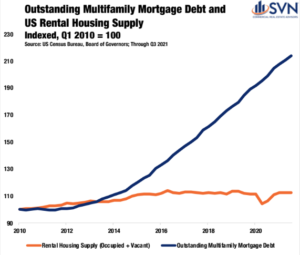
For the year ahead, there is at least some concern over how the sector will absorb higher interest rates as the Federal Reserve readies multiple rate hikes. Since 2010, the number of rented housing units in the US has expanded by about 13%.3 Over the same time, the amount of outstanding multifamily debt in the country has more than doubled (+114%).4 In short, the US rental housing sector has become substantially more leveraged over the past decade. Given the relative increase in indebtedness and the specter for higher debt servicing costs on the horizon, this is an area that deserves some risk consideration in the year ahead.
Still, all else equal, the balance of factors broadly supports continued investment success in the US rental housing sector in 2022. With an eye on the horizon, Mr. Bennett identifies three underlying factors that should strengthen the sector in 2022:
• A high number of new entrants into the space (including retail buyers, office buyers, and multifamily syndicators) are competing with an
already crowded pool of multifamily buyers.
• Household formations and Baby Boomers re-entering the rental pool will continue to support stiff competition for incoming supply.
• This year (2022) will be the last year of 100% bonus depreciation, where many buyers will be overextending to receive this benefit for
themselves and their investors.
1. Chandan Economics analysis of US Census Bureau Data
2. Chandan Economics analysis of US Census Bureau Dat
3. US Census Bureau
4. https://www.osc.state.ny.us/files/reports/osdc/pdf/report-10-2022.pdf
Financial Performance
TRANSACTION VOLUME
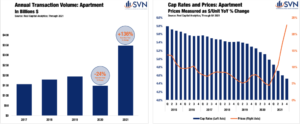
If 2020 was the year where dealmakers were sitting on the sidelines, then 2021 was the year where there were too many players on the field. According to Real Capital Analytics, annual transaction volume in 2021 totaled an incredible $332B — a 128% surge from 2020’s pandemic- impacted total of $147B. Moreover, the 2021 total stands as a 74% increase over the previous all-time high set in 2019.5 While the entire year was marked by consistently higher transaction volumes, the year-end record totals are largely a function of an unprecedented spike in deal activity in Q4. In the last three months of the year, RCA tracked $149B in apartment sales, more than any two other quarters combined last year.
CAP RATES AND PRICING
Cap rates for Multifamily properties continued to sink in 2021, reaching new a new all-time low of 4.5% in Q4.6 Similarly, the spread between apartment cap rates and the 10-year Treasury, a measure of the sector’s perceived riskiness, fell to 298 bps in Q4 2021 — the lowest level since Q1 2019.7 In total, apartment cap rates fell 48 bps between the start and the end of 2021, marking the most significant annual cap rate decline since before the Great Financial Crisis (GFC). With benchmark interest rates set to rise in 2022 as the Federal Reserve initiates its monetary tightening cycle, some upward pressure on cap rates may be on the horizon.
Declining cap rates in 2021 led to some significant upward pressure on pricing. As part of Real Capital Analytics’ post-2001 tracking, never have apartment asset values grown faster than 15% on an annual basis— that is, of course, until 2021. As of Q4 2021, average apartment unit prices finished the year at $ 213,761, a record-breaking 19.6% higher than a year earlier.8
Across sub-sectors, Garden-style apartment units, which tend to be in more suburban locations, once again experienced the most pricing growth in 2021. These Garden units saw asset prices rise by an incredible 21.8% last year, besting the sector-wide average by 2.2 percentage points.9 Meanwhile, Mid/High-rise apartment units saw the least robust price appreciation of all sub-sectors in 2021, growing by just 10.8%.10 Still, the annual improvement for the most urban-centric property type should not be overlooked. While Mid/High-rise units saw the least amount of price appreciation last year, they saw the most relative improvement. To close out 2020, valuations for Mid/High-rise units sank 3.5% year-over-year, making the 2021 mark a swing of 14.2 percentage points.11
5. Real Capital Analytics; Through Q4 2021
6. Real Capital Analytics; Through Q4 2021
7. Real Capital Analytics; Through Q4 2021
8. Real Capital Analytics; Through Q4 2021
9. Real Capital Analytics; Through Q4 2021
10. Real Capital Analytics; Through Q4 2021
11. Real Capital Analytics; Through Q4 2021
Markets Making Headlines
BLAZING HOT IN THE SUNSHINE STATE
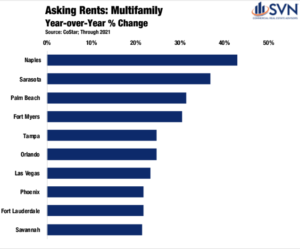
The Sun Belt, and more specifically, the southeastern portion of the country, continues to be the largest hotbed for population growth and new housing demand. According to the latest US Census Bureau data, the South added roughly 816,000 new residents in 2021 alone. On a state-by-state basis, Florida remains the epicenter of the Southeast’s dominating success. In the last decade, the Sunshine State has come a long way to rebrand itself away from the Heaven’s Waiting Room nicknames of the past. Naples, FL, saw the single largest jump in market rents in 2021. According to CoStar, rents in Naples averaged $1,527 at the end of 2020. Fast forward to end the end of 2021, and average rents were nearly 43% higher at $2,183.12 Heading up Florida’s west coast, there are more rent growth accolades to go around. Fort Myers and Tampa ranked fourth and fifth for major metros posting the most rent growth last year, with rent growth coming in at 30.4% and 24.8%,
respectively.13
Cut over to Florida’s east coast, and the story is effectively the same. According to Tim Davis, CCIM of SVN | Alliance Commercial Real Estate Advisors, “the housing supply shortage continues to grow in the Daytona Beach market area, generating continued demand for rental product.” Mr. Davis notes that new rental housing is needed across a number of different sub-asset types, including “traditional garden-style development, as well as cottages and BFR options.” In 2021, Daytona beach saw the country’s third-largest rise in Multifamily occupancy rates and the fifth-largest increase in asset valuations.14 Florida’s east coast success is attributable to “job growth along the I-95 corridor related to work from home policies, manufacturing, distribution, and private space exploration,” according to Mr. Davis.
Beyond the Sunshine State, the rest of the Southeast is also seeing widespread success. Durham, NC posted a 5.0 percentage point increase in its market-wide Multifamily occupancy rate through the end of last year, the fourth-best mark in the country.15 Savannah, GA, saw the tenth-largest increase in Multifamily rents across the US, with prices rising an appreciable 21.4% over the year ending Q4 2021.16
OFF THE COAST, REASONS TO BOAST
A general theme throughout the other top-performing multifamily markets around the country is that they tend to be ascending secondary metros that are more affordable and off either coast (excluding Florida). The two markets experiencing the highest levels of rent growth in the country outside of Florida are Las Vegas and Phoenix, which saw growth totals of 23.3% and 21.8% last year, respectively.17
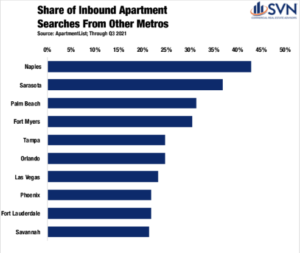
Austin in recent years has gained the status of a “revolving door” market, a title given by Apartment List for its heavy flow of both inbound and
outbound renters. As of Q3 2021, Apartment List reports Austin as the sixth-highest share of renters looking to jump to a new metro, as well as the seventh-highest share of inbound searches coming from renters elsewhere. Generally, this lines up with Austin’s profile rise as a young, tech-centric city where early-career professionals call home for a few years. Rent growth in Austin was robust last year, with prices growing 20.6%.18
Head due north from the Lone Star, and you’ll find another State seeing
a fair share of success: Oklahoma. According to Raymond Lord of SVN
OAK Realty Advisors, in 2021, “the Oklahoma City and Tulsa Multifamily
market like many US Markets was incredibly active in apartment transactions.” Mr. Lord goes on to note that “Oklahoma City set a record at $961.8 million in 2021, […] [surpassing] the previous record of $541.3 in 2019.” In Tulsa, the story was more of the same, as it “also had record transactions in 2021 at $503.6 million versus $208.6 million in 2020.”
12. CoStar; Through Q4 2021. Note: Measured across the top-100 markets
13. CoStar; Through Q4 2021. Note: Measured across the top-100 markets
14. CoStar; Through Q4 2021. Note: Measured across the top-100 markets
15. CoStar; Through Q4 2021. Note: Measured across the top-100 markets
16. CoStar; Through Q4 2021. Note: Measured across the top-100 markets
17. CoStar; Through Q4 2021. Note: Measured across the top-100 markets
18. CoStar; Through Q4 2021. Note: Measured across the top-100 markets
ECONOMIC GROWTH
The US economy has experienced a robust recovery from the initial shock of
COVID-19. A pandemic-driven shift in consumption away from services and into
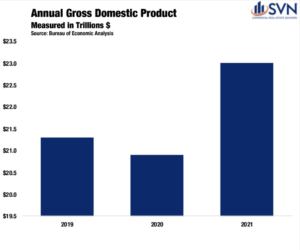
goods, boosted by a sweeping stimulus effort, reconditioned our economy well before an off-ramp from the public health crisis was in sight. By Q3 2020, inflation-adjusted GDP shrugged off its worst quarterly performance on record to record its best, a 33.4% annualized growth rate.1 In 2021, the total nominal value of all consumption and production reached $23.0 trillion, a 9.1% increase above 2020’s total and 6.9% above 2019’s total. After adjusting for inflation, the US economy is 3.2% larger than its pre-pandemic peak.2
The foundation of the economy’s rebound has been a swift labor market recovery. At its April 2020 peak, the official unemployment total reached a staggering 23 million people.3 By the start of 2021, the unemployment total had improved to just 10.1 million people out of work.4 Over the past year, this level has come down to 6.5 million people, less than one million above the pre-pandemic level of 5.7 million.5
INFLATION & MONETARY POLICY
One year ago, the market consensus was that the Federal Open Market Committee (FOMC) would not begin a monetary policy tightening cycle until 2023. However, as demand surges in the face of gummed-up supply chains, rampant inflation has emerged at center stage, forcing shifting guidance from policymakers.
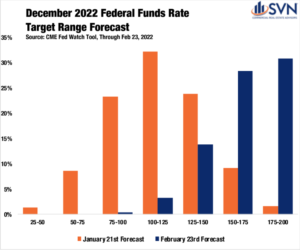
After decades of tepid price increases, in January 2022, the Consumer Price Index (CPI) reached 7.5%, a level not seen in 40 years.6 Core-PCE, the Federal Reserve’s preferred inflation gauge that excludes food and energy prices, reached 5.2% in January, prompting the FOMC to be increasingly committed to an interest-rate hike at its March 2022 meeting.7 In just 24 months, policymakers at the Federal Reserve have repositioned themselves from a tighter monetary policy stance into an accommodative one and back to a tightening one. According to the CME Fed Watch Tool, as of February 23rd, future markets are forecasting seven rate hikes by the end of the year — a sizable shift from even just one month earlier, when future markets were forecasting just four rate hikes in 2022. Volatile swings in the medium-term outlook are symptomatic of the rapid shifts in economic activity that categorized the past two years.
In December, Fed officials looked on cautiously at the near-term outlook as Omicron emerged as a roadblock to economic normalcy. After the Delta variant led to declining activity and sluggish job growth in mid-to-late summer 2021, some officials worried that Omicron, a more transmissible variant of COVID compared to previous waves, would hinder the recovery. While a significant wave of US cases followed, the Omicron wave proved to be less deadly and less straining on the US public health system than previous ones. As a result, an increasing number of US states and municipalities are relaxing masking and vaccine restrictions. On February 25th, the CDC introduced a new slate of guidelines that experts say shifts the US into the “endemic phase” of the pandemic. The new guidelines would put more than half of US counties and over 70% of the population in “low” or “medium” risk designations, bolstering the FOMC’s willingness to remove accommodative monetary policies.
THE GREY AREAS
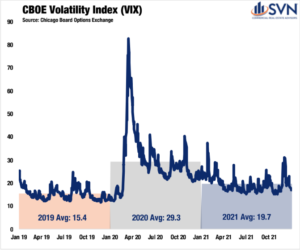
Still, a measurable dose of uncertainty overhangs stock markets and the whole macroeconomy. The VIX, a volatility index captured by the Chicago Board Options Exchange, has remained stubbornly elevated since the onset of the pandemic. Despite moderately retracting during the fall of 2021, the annual average for the VIX in 2021 was 19.7, 27.7% above its 2019 average.8
1. US Bureau Economic Analysis
2. US Bureau Economic Analysis
3. US Bureau Labor Statistics
4. US Bureau Labor Statistics
5. US Bureau Labor Statistics
6. US Bureau Labor Statistics
7. US Bureau of Economic Analysis
8. Chicago Board Options Exchange
About SVN
SVN International Corp. (SVNIC), a full-
service commercial real estate franchisor of the SVN® brand, is one of the industry’s most recognized names based on the annual Lipsey Top Brand Survey. With nearly 200 locations serving 500 markets, SVN provides
sales, leasing, corporate services and property management services to clients across the globe. SVN Advisors also represent clients
in auction services, corporate real estate, distressed properties, golf & resort, hospitality, industrial, investment services, land, medical,
multifamily, office, retail, self-storage and single tenant investments. All SVN offices are independently owned and operated.
For more information, visit www.svn.com/.
Look for all of the 2022 Commercial Asset Class Reports at southlandcommercial.com (linked below).
Multi-family Commercial Asset Class Report
Retail Commercial Asset Class Report
Office Commercial Asset Class Report
Industrial Commercial Asset Class Report
View all current SVN Southland listings here.
« Previous Next »


