Naveed Hameed / April 11, 2022
Commercial Real Estate Asset Class – Office
Contents
- National Overview
- Financial Performance
- Markets Making Headlines
- Macroeconomy
- About SVN
Commercial Real Estate Asset Class: Office – (Download Full PDF)
National Overview
OFFICE
As the pandemic sent corporate America from boardrooms to bedrooms in 2020,
long-held assumptions about productivity are now rightfully up for debate. On one side of the spectrum are those that argue that office spaces facilitate an agglomeration of ideas, culture, and productive output. On the other hand, many argue that long commutes into places of work are outdated norms, and the commute time saved by remote work can generate both greater worker productivity and improved quality of life — a classic case of having the cake and eating it too. Now, with 2021 in the rearview, and after two distinct COVID waves derailed back-to-office timelines, there has been little resolution to the so-called big questions from a year ago.
According to The Pew Research Center, as of January 2022, for American adults
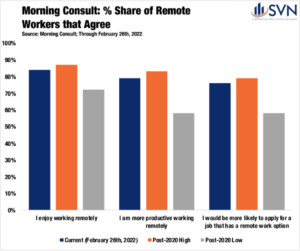
who report being able to complete their jobs from home, 59% are doing so most or all of the time, and 18% do so some of the time. The VTS Office Index (VODI), which measures new Office leasing demand, remained down by 42% relative to its pre-pandemic benchmark through the end of 2021. As the public health threat lessens, these data will undoubtably improve, but the question is by how much. In a tight labor market, the desires of workers can quickly transition into leverage-able demands. According to Morning Consult’s tracking of remote workers, 84% have enjoyed being remote, 79% feel they are more productive working remotely, and 76% would be more likely to apply for a job that offers remote work.1
SVN® Product Council Office Chair Justin Horwitz notes that “arguably, Office properties were the most negatively impacted of all the product types as a result of the pandemic.” However, he holds that 2021 was a year of recovery as sales volumes came back to peak levels thanks to returning “investor demand for quality office buildings, […] particularly for well-stabilized assets in strong locations.”
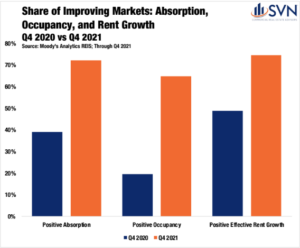
In their Q4 2021 report, Moody’s Analytics REIS attests that while the stage was set for Office sector distress in 2021, the incoming performance
data failed to show it.2 Effective rent growth remained negative to begin last year but had returned to growth by the third quarter. Through Q4 2021, of the 82 markets that Reis tracks, 59 had positive absorption, 53 had improving occupancy, and 61 saw improving rent growth — a stark contrast from one year ago.
The open questions over the workplace of the future and its role in our daily lives appear most pertinent to Gateway markets such as New York. According to New York’s MTA, ridership of NYC’s subway system is forecast to be a long way off pre-pandemic ridership levels through 2025.3 Moreover, many of its stations seeing the largest declines in ridership are in Central Business Districts (CBDs) such as Midtown and Manhattan’s downtown Financial District.
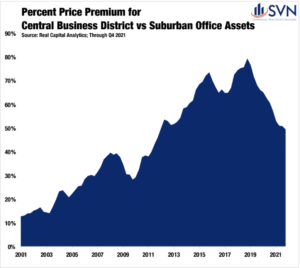
Outside of Gateway markets, the picture on the horizon appears a bit rosier. According to a Chandan Economics analysis of Real Capital Analytics data, Suburban Office valuations continue to soar. Over the past three years, the relative price per square foot premium an Office sector investor would have to pay for a CBD asset over a Suburban asset shrank from 79% to just 49%. Mr. Horwitz notes that “suburban markets are the beneficiary of businesses adjusting to the “new normal.”
1. Morning Consult, as of February 26th, 2022.
2. Moody’s Analytics REIS, report found here: https://cre.moodysanalytics.com/insights/cre-trends/q4-2021-office-first-glance/
3. https://www.osc.state.ny.us/files/reports/osdc/pdf/report-10-2022.pdf
Financial Performance
TRANSACTION VOLUME
Transaction volumes for Office assets saw considerable improvement in 2021. According to Real Capital Analytics, more than $139 billion of asset value traded hands last year, a 56.5% improvement over 2020’s total. Still, despite the improvement, the Office sector was the only major CRE property type that did not eclipse its 2019 peak in 2021, as transaction volumes fell about $5 billion short.4 While the resumption of strong trading volumes is encouraging, the apparent lack of pent-up demand that has been observed in other property types may signal continued concern for the sector as hybrid work figures to be a market-shaping force for years to come.
CAP RATES AND PRICING
Cap rates for Office properties declined steadily throughout 2021, finishing the year with a sector average of 6.2% — down 31 bps year-over-year.5 Suburban Office assets continued their bull run in 2021 as pandemic-induced migration patterns and remote work adoption has proven broadly supportive of suburban commercial real estate at the expense of central cities, especially in Gateway markets. Last year, cap rates for suburban Office assets sank by 38 bps, settling at 6.3%.6 As recently as mid-2019, the cap rate spread between suburban and Central Business District located Office assets stood as high as 147 bps.7 Through Q4 2021, this spread has fallen to just 55 bps.8 Medical Office assets also saw significant cap rate compression last year, declining 38 bps to 5.9%.9 Meanwhile, Single Tenant Office assets saw cap rates fall by just 4 bps, landing at 6.5%. Central Business District Office assets, the most maligned property group in the sector, saw cap rates rise by 18 bps in 2021, settling at 5.8%.10
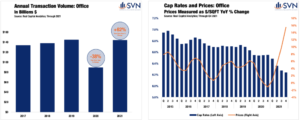
Prices for Office assets finished 2021 up an average of 6.1% from the year earlier. Single Tenant Office assets were the clear laggard of the group, as prices increased by just 5.4% year-over-year through Q4 2021. CBD assets followed next with annual price appreciation rates of 10.4%. Again, Suburban and Medical Office properties were the clear winners in 2021, as prices grew an average of 15.1% and 15.5%, respectively.
4. Real Capital Analytics; Through Q4 2021
5. Real Capital Analytics; Through Q4 2021
6. Real Capital Analytics; Through Q4 2021
7. Real Capital Analytics; Throughout Q4 2021
8. Real Capital Analytics; Throughout Q4 2021
9. Real Capital Analytics; Throughout Q4 2021
10. Real Capital Analytics; Throughout Q4 2021
Markets Making Headlines
TERTIARY WESTERN MARKETS ON THE RISE
The major Office success stories throughout the pandemic have come from outside of the traditional globalized markets like New York, San
Francisco, and Los Angeles. Instead, outflowing residents and businesses from the traditional hubs into tertiary alternatives has generated
momentum for a number of well-positioned smaller cities.
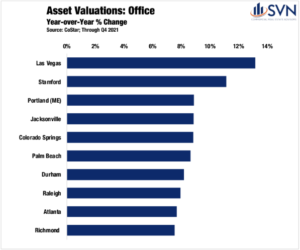
Nevada continues to be a standout in this area. Las Vegas seemingly has gleaned lessons from the Great Recession, and over the past decade,
it has made significant progress in diversifying its labor market. Las Vegas led all other metros for the largest gains in Office sector property
valuations last year (+13.2%), according to CoStar. For nearby Reno, it is a similar story. The rising competitiveness of Reno saw its Office
sector post the nation’s third-biggest jump in rents (+4.9%) and the fourth largest jump in occupancy rates (+1.6%) last year.11 The Economic
Development Authority of Western Nevada credits Reno’s recent success to a decade-long labor diversification plan adopted in Washoe
County.12 Reno’s unemployment rate sat at a rock bottom 2.8% at the end of 2021 — 1.1 percentage points better than the national average.13
Moving beyond Nevada, several other secondary cities in the West continue to see their stock rise. San Diego posted a sizable jump in Office
space net absorption totals in Q4 2021, coming in at 648,414 square feet, surging from just 2,913 square feet in the same period the year
prior.14 Colorado Springs, CO, stands as a rare example of a metro where there are more employees today (310k) than there were entering the
pandemic (305k).15 According to CoStar, the relatively small Colorado city posted the fifth biggest jump in Office sector valuations last year,
rising a healthy 8.8%.16
In Spokane, WA, short-term headaches created by the pandemic are pitted against long-term improving fundamentals. According to Guy Byrd
of SVN | Cornerstone, “Spokane’s CBD has been the weakest performing market in the last year as a significant number of tenants are choosing
the increasingly popular hybrid work model.” He goes on to cite that “recruiting top talent and providing attractive work environments for
workers who now prefer remote work is a significant new
challenge.” Still, Washington State anticipates that Spokane
will be a site for significant growth in the years ahead. While
Spokane County is home to just over half a million people,
the State’s Office of Financial Management projects that its
resident population will swell by another 90k by the year
2040.17 Despite the ongoing headwinds, Mr. Byrd notes that
vacancy rates improved last year as “users were forced to
reinvent the most effective office environment.” Moreover,
sales volumes also ticked up in 2021 “due to low interest rates
and minimal new office construction,” a trend that forecasts
should carry into 2022, “subject to economic conditions vital
to the market.”
THE UNRETIREMENT COMMUNITY
Success begets success. Florida saw its population grow by 211k people in 2021 — more than every state not named Texas.18 With the influx of new residents, there is increased demand throughout all verticals of commercial real estate. After all, these incoming residents need places to live, places to shop, and places to work. Florida’s Office markets, including in suburban settings, saw statewide success in 2021.
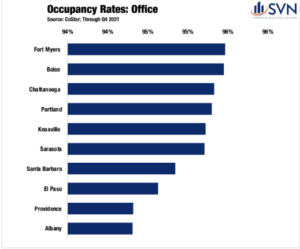
Fort Myers, a smaller Office sector compared to Florida’s more developed alternatives, has seen demand far outpace supply as it currently boasts the highest market-level occupancy rate (95.5%) in the country.19 Moreover, between the end of 2020 and the end of 2021, the Office occupancy rate rose by the second-highest clip in the country, growing by 1.8 percentage points.20
According to SVN | Commercial Advisory Group’s Larry Starr, Sarasota is
“boasting some of the strongest office rent growth in the country,” a claim
that is backed up by CoStar data, which shows rents in the area growing by
5.3% last year.21 “Office demand has remained strong in Sarasota throughout
2021, pushing vacancies to new lows.” In Tampa, a metro that has seen as much commercial real estate success as sporting success over the past half-decade, saw firming demand last year. Mr. Starr notes that Tampa remained a standout as “both asking rents and office demand improved throughout 2021, significantly outperforming the National Index.” Mr. Starr does see the potential for some softness in 2022, suggesting that Tampa’s office sector will be “challenged due to the increase in the amount of space available on the market,” as the pandemic triggered “the largest supply wave in over a decade.” Still, he sees the rising profile of Tampa and its ability to attract re-locating businesses as broadly supportive of the city’s long-term fundamentals, citing that “office investment activity has sharply increased with annual sales volume roughly doubling 2020 levels.”
11. CoStar; Through Q4 2021. Note: Measured across the top-100 markets
12. https://knpr.org/knpr/2022-02/northern-nevadas-economic-diversification-helped-soften-impact-pandemic-can-southern
13. Bureau of Labor Statistics
14. CoStar; Through Q4 2021. Note: Measured across the top-100 markets
15. Bureau of Labor Statistics; Through December 2021
16. CoStar; Through Q4 2021. Note: Measured across the top-100 markets
17. https://www.krem.com/article/money/economy/boomtown-inland-northwest/spokane-county-future-growth/293-
6859dcc0-bd63-40ef-8f16-c483fa61c9e1
18. US Census Bureau
19. CoStar; Through Q4 2021. Note: Measured across the top-100 markets
20. CoStar; Through Q4 2021. Note: Measured across the top-100 markets
21. CoStar; Through Q4 2021. Note: Measured across the top-100 markets
Macro Economy
ECONOMIC GROWTH
The US economy has experienced a robust recovery from the initial shock of
COVID-19. A pandemic-driven shift in consumption away from services and into
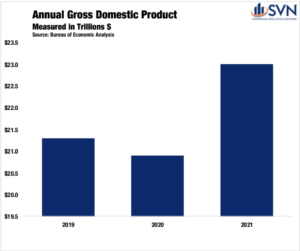
goods, boosted by a sweeping stimulus effort, reconditioned our economy well before an off-ramp from the public health crisis was in sight. By Q3 2020, inflation- adjusted GDP shrugged off its worst quarterly performance on record to record its best, a 33.4% annualized growth rate.1 In 2021, the total nominal value of all consumption and production reached $23.0 trillion, a 9.1% increase above 2020’s total and 6.9% above 2019’s total. After adjusting for inflation, the US economy is 3.2% larger than its pre-pandemic peak.2
The foundation of the economy’s rebound has been a swift labor market recovery. At its April 2020 peak, the official unemployment total reached a staggering 23million people.3 By the start of 2021, the unemployment total had improved to just 10.1 million people out of work.4 Over the past year, this level has come down to 6.5 million people, less than one million above the pre-pandemic level of 5.7 million.5
INFLATION & MONETARY POLICY
One year ago, the market consensus was that the Federal Open Market Committee (FOMC) would not begin a monetary policy tightening
cycle until 2023. However, as demand surges in the face of gummed-up supply chains, rampant inflation has emerged at center stage, forcing
shifting guidance from policymakers.
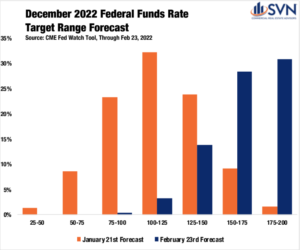
After decades of tepid price increases, in January 2022, the Consumer Price Index (CPI) reached 7.5%, a level not seen in 40 years.6 Core-PCE, the Federal Reserve’s preferred inflation gauge that excludes food and energy prices, reached 5.2% in January, prompting the FOMC to be increasingly committed to an interest-rate hike at its March 2022 meeting.7 In just 24 months, policymakers at the Federal Reserve have repositioned themselves from a tighter monetary policy stance into an accommodative one and back to a tightening one. According to the CME Fed Watch Tool, as of February 23rd, future markets are forecasting seven rate hikes by the end of the year — a sizable shift from even just one month earlier, when future markets were forecasting just four rate hikes in 2022. Volatile swings in the medium-term outlook are symptomatic of the rapid shifts in economic activity that categorized the past two years.
In December, Fed officials looked on cautiously at the near-term outlook as Omicron emerged as a roadblock to economic normalcy. After
the Delta variant led to declining activity and sluggish job growth in mid-to-late summer 2021, some officials worried that Omicron, a more
transmissible variant of COVID compared to previous waves, would hinder the recovery. While a significant wave of US cases followed, the
Omicron wave proved to be less deadly and less straining on the US public health system than previous ones. As a result, an increasing
number of US states and municipalities are relaxing masking and vaccine restrictions. On February 25th, the CDC introduced a new slate
of guidelines that experts say shifts the US into the “endemic phase” of the pandemic. The new guidelines would put more than half of US
counties and over 70% of the population in “low” or “medium” risk designations, bolstering the FOMC’s willingness to remove accommodative
monetary policies.
THE GREY AREAS
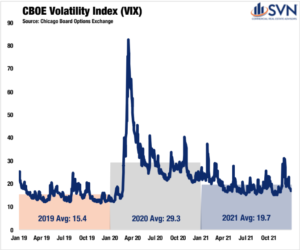
Still, a measurable dose of uncertainty overhangs stock markets and the whole macroeconomy. The VIX, a volatility index captured by the Chicago Board Options Exchange, has remained stubbornly elevated since the onset of the pandemic. Despite moderately retracting during the fall of 2021, the annual average for the VIX in 2021 was 19.7, 27.7% above it 2019 average.8
1. US Bureau Economic Analysis
2. US Bureau Economic Analysis
3. US Bureau Labor Statistics
4. US Bureau Labor Statistics
5. US Bureau Labor Statistics
6. US Bureau Labor Statistics
7. US Bureau of Economic Analysis
8. Chicago Board Options Exchange
About SVN
SVN International Corp. (SVNIC), a full-
service commercial real estate franchise of the SVN® brand, is one of the industry’s most recognized names based on the annual Lipsey Top Brand Survey. With nearly 200 locations serving 500 markets, SVN provides
sales, leasing, corporate services and property management services to clients across the globe. SVN Advisors also represent clients in auction services, corporate real estate, distressed properties, golf & resort, hospitality,
industrial, investment services, land, medical, multifamily, office, retail, self-storage and single tenant investments. All SVN offices are independently owned and operated.
For more information, visit www.svn.com/.
Look for all of the 2022 Commercial Asset Class Reports at southlandcommercial.com (linked below).
Multi-family Commercial Asset Class Report
Retail Commercial Asset Class Report
Office Commercial Asset Class Report
Industrial Commercial Asset Class Report
View all current SVN Southland listings here.
« Previous Next »


